If you are new to IntelligenceX chat, this is the kind of walkthrough we wish we had on day one. No theory slides, no fluffy diagrams, just a real session and what each screen actually shows. We will move through it in four layers:
- the active chat flow for your current task
- profile-level defaults you can reuse
- system-level settings that shape global behavior
- tool visibility controls for safer, more focused runs
The thread here is AD-focused, and the Options screenshots focus on Profile, System, and Tools.
From first question to action plan
This is one continuous conversation, from "what's up in AD?" to a concrete hardening plan you can actually execute.
Opening question and fast triage
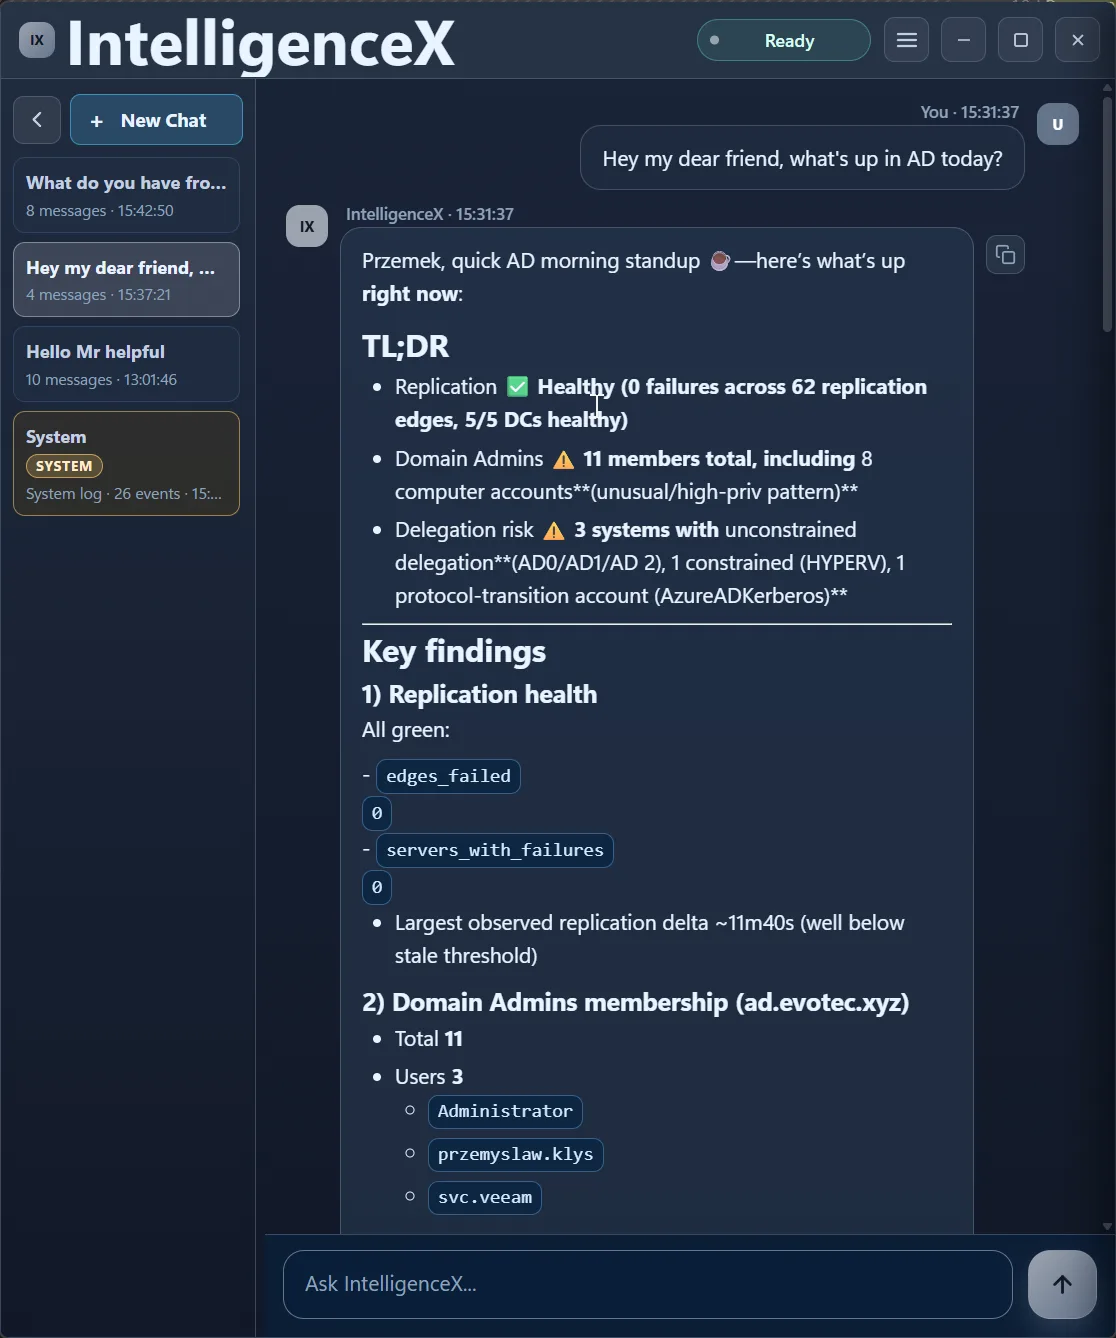
It starts with a very simple prompt. The assistant immediately answers with a clean TL;DR: replication health, Domain Admins membership, and delegation exposure.
Scrolling into the evidence
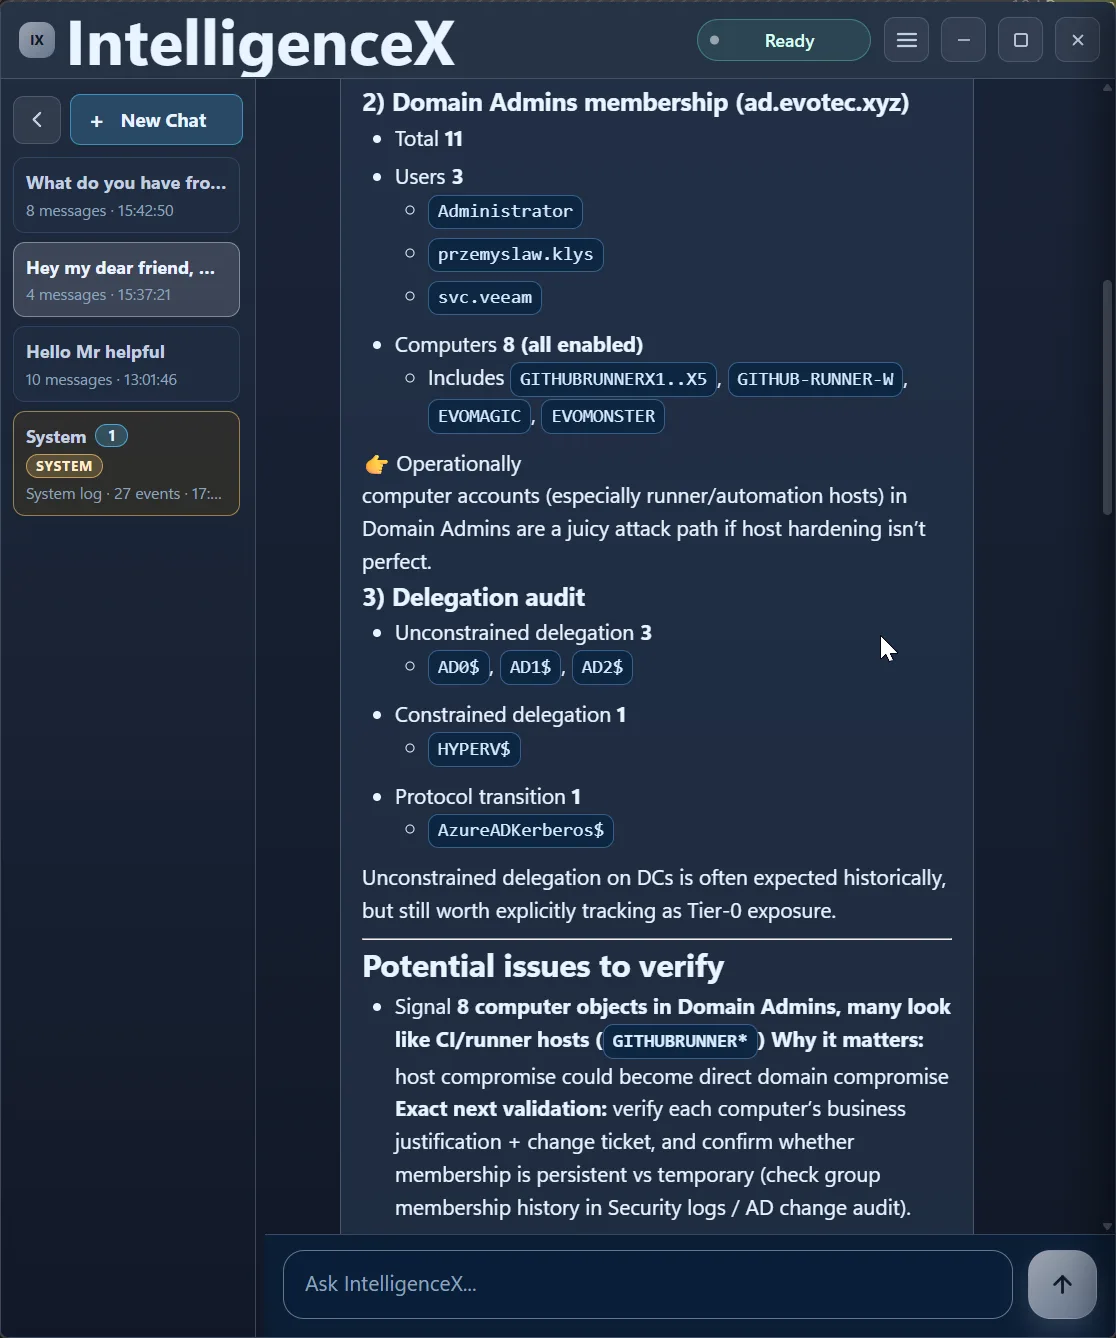
As you scroll, the same reply gets more detailed: users/computers in Domain Admins, unconstrained vs constrained delegation, and a "Potential issues to verify" section.
Recommendations, not just findings
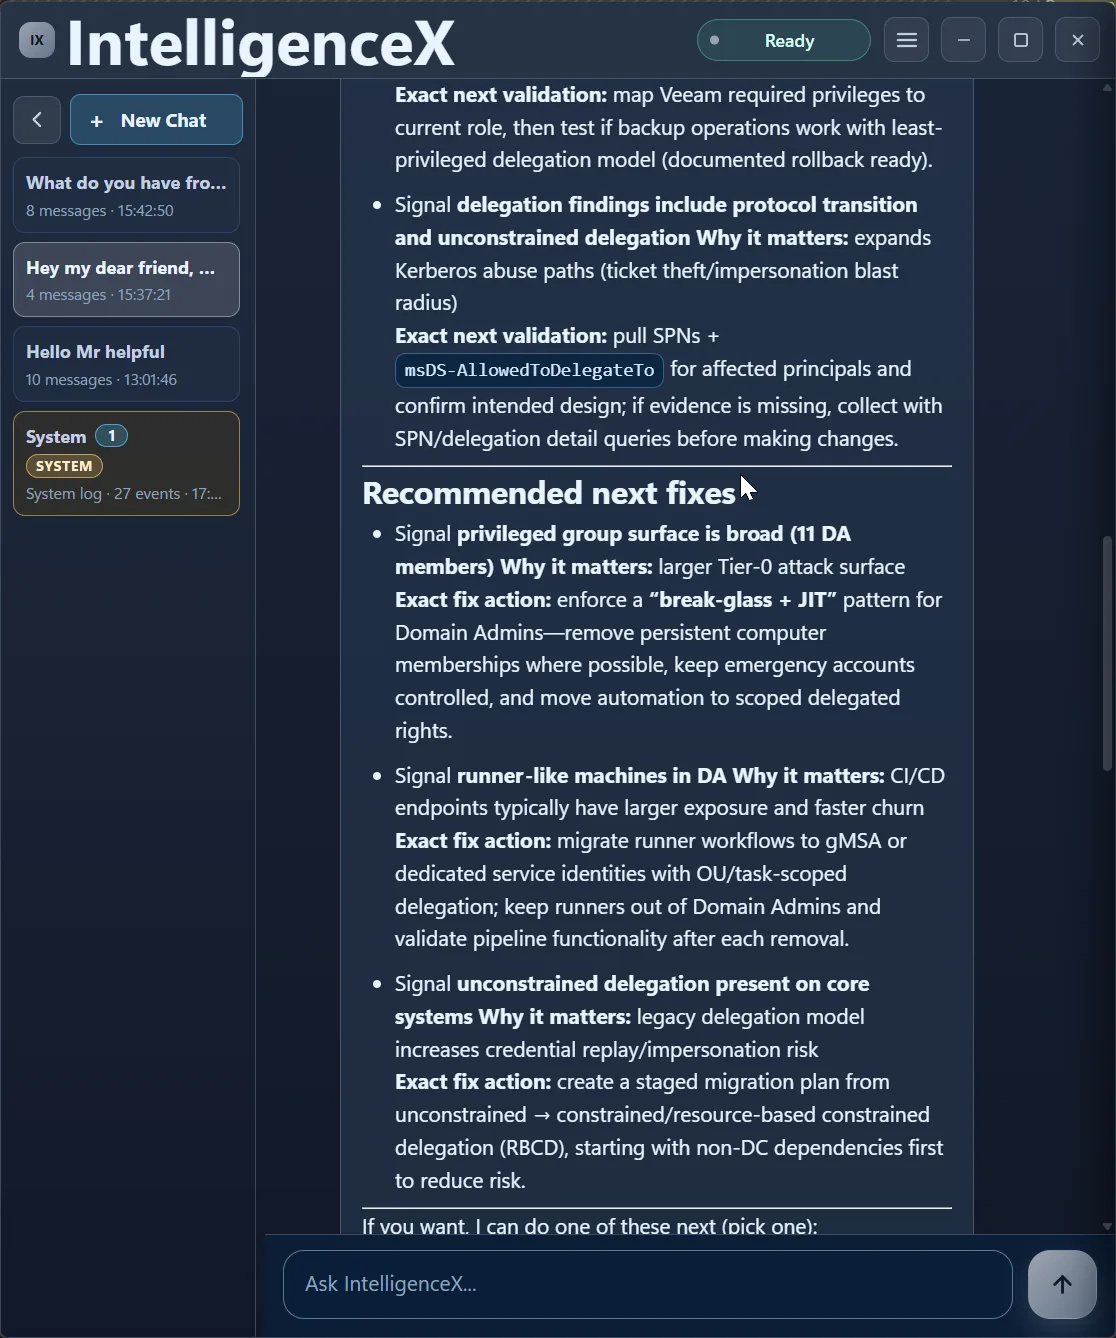
This is where it gets practical. Instead of stopping at findings, the thread proposes priority fixes: break-glass/JIT access, reducing runner-like privileged exposure, and a safer delegation migration path.
Turning analysis into immediate actions
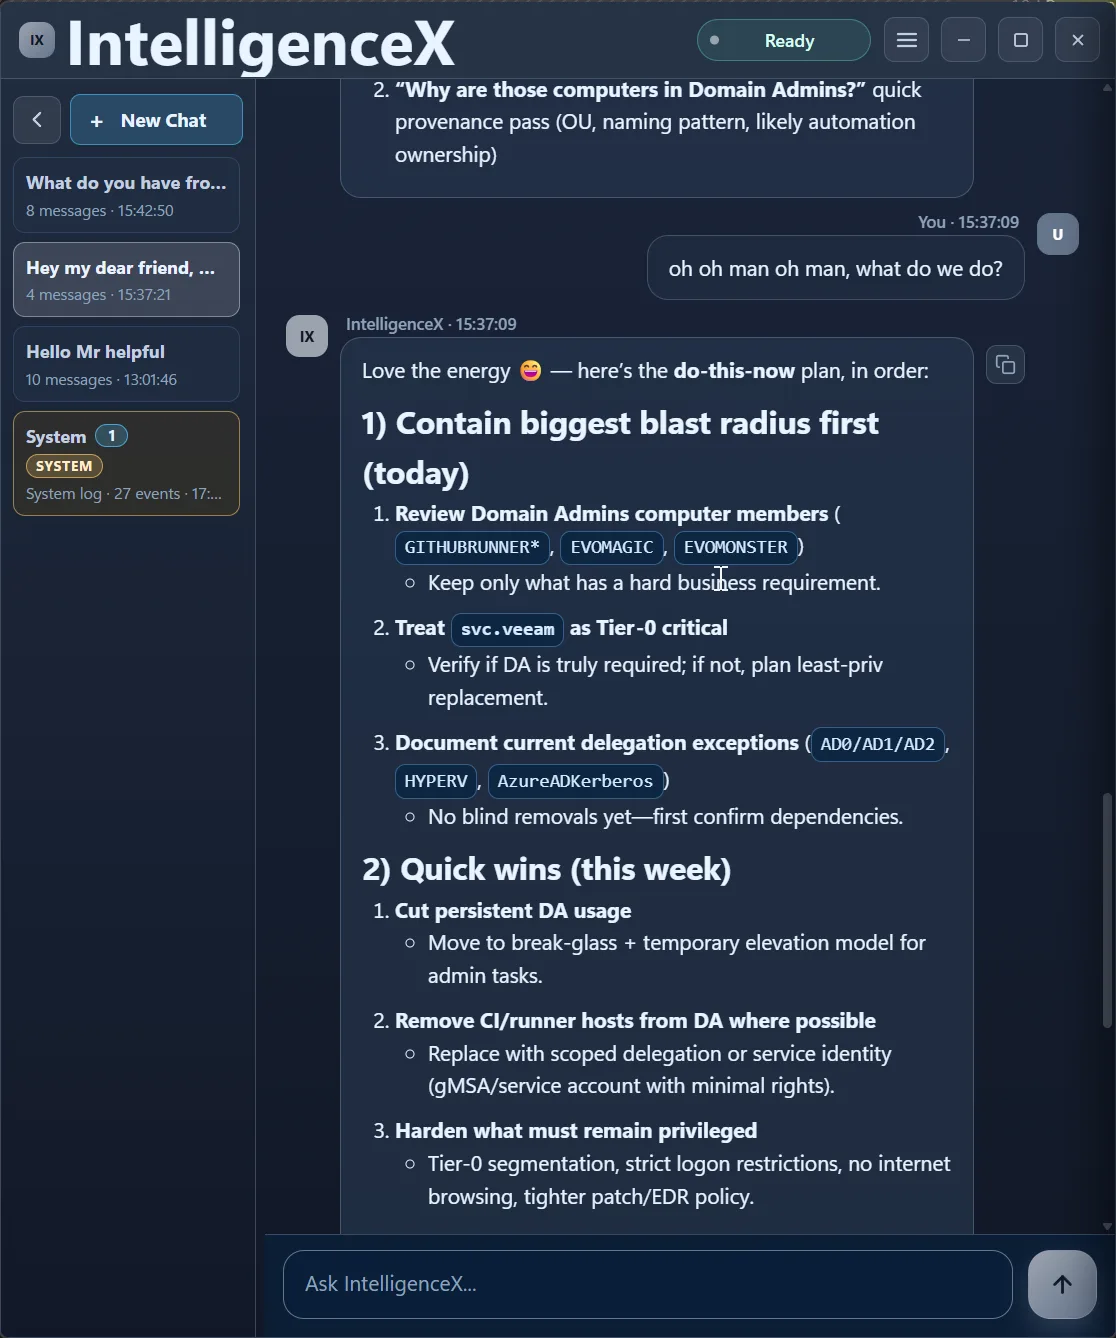
After a natural follow-up ("what do we do?"), the assistant switches from analysis to action mode with "Contain biggest blast radius first" and "Quick wins (this week)."
Guardrails before you cut privilege
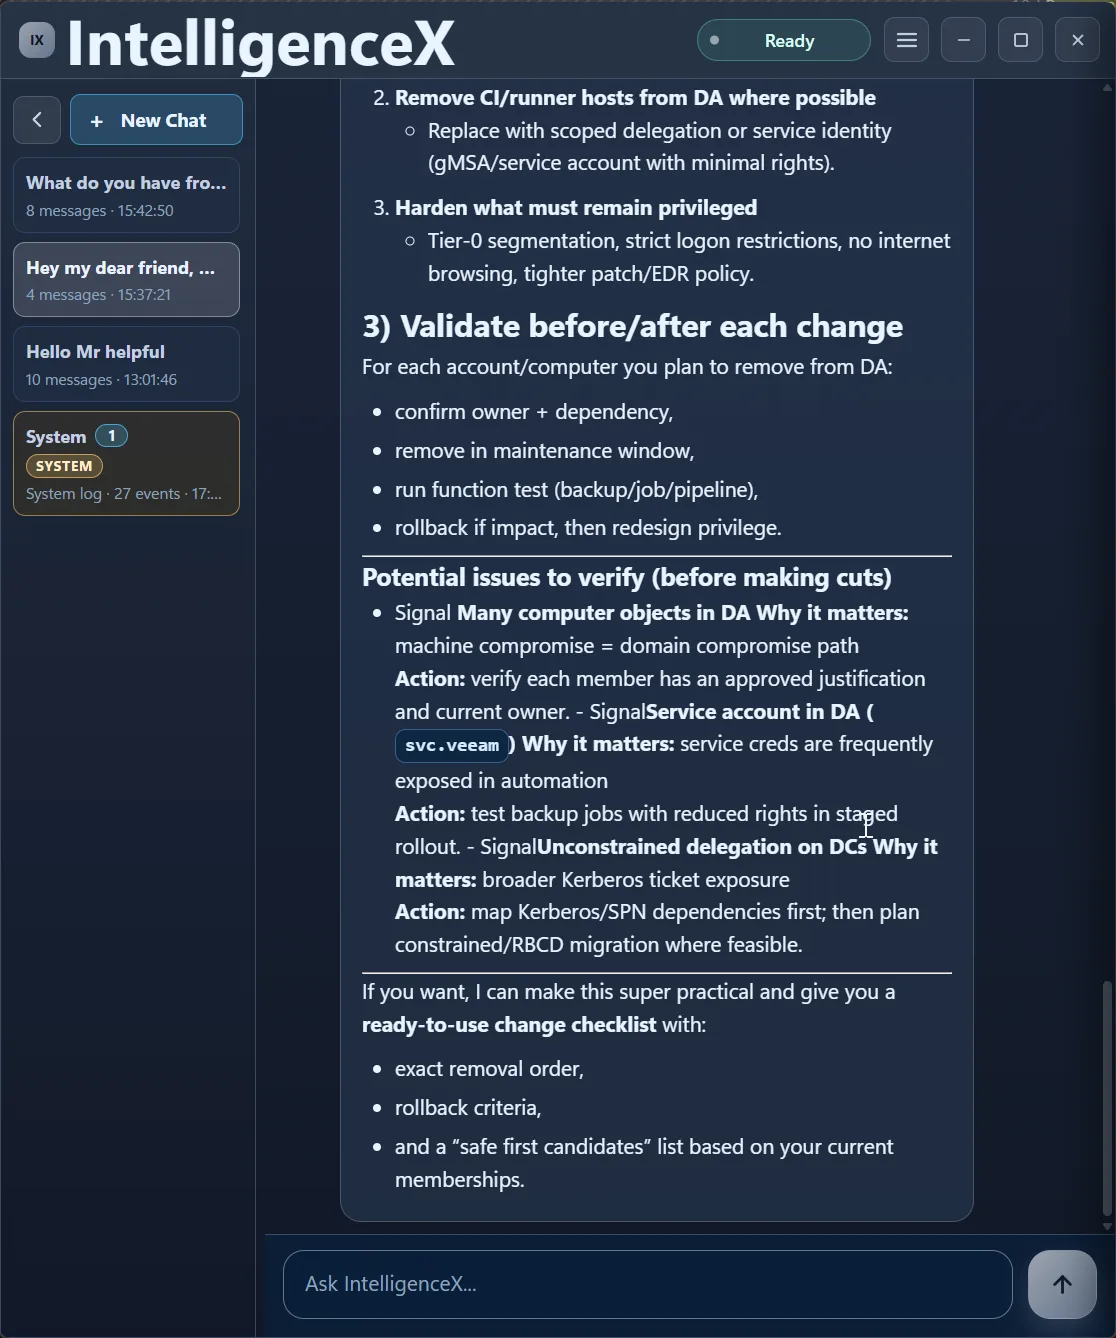
The close is all about not breaking production: validate before/after each change, confirm ownership/dependencies, and run pre-change risk checks before removing privileged memberships.
Profile Options
Think of profiles as your reusable baseline: same structure, different defaults, fast to apply.
Default profile in Graphite
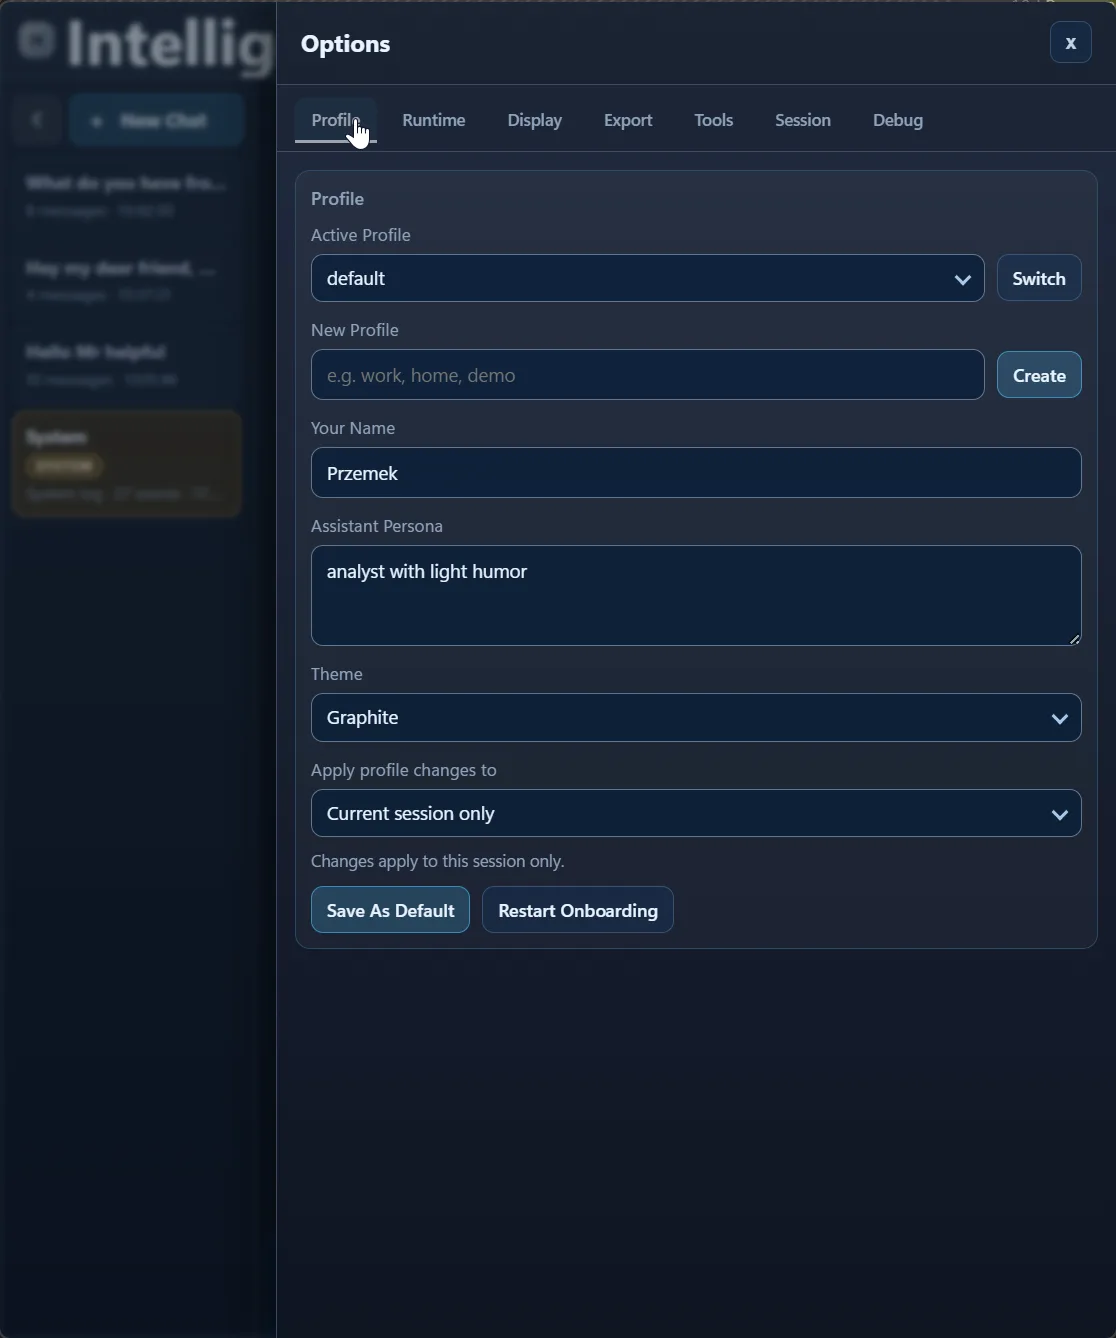
default is selected with Graphite , along with persona text, apply scope ( Current session only ), and "Save As Default."
Same profile in Emerald
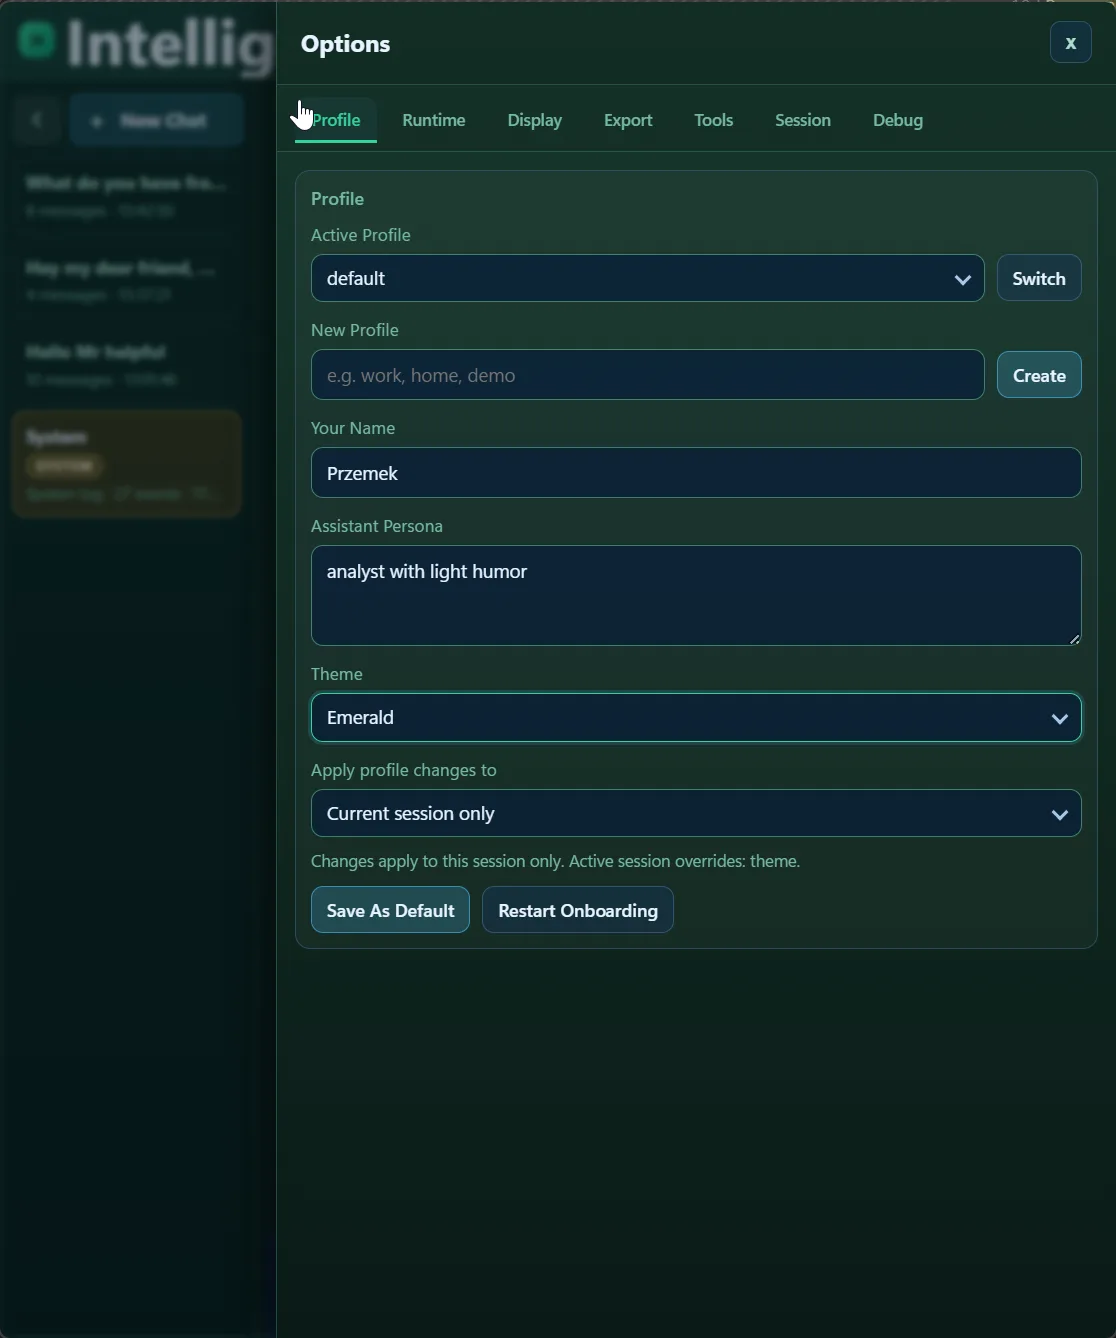
Same profile fields, now with Emerald . The point is simple: behavior model stays the same, visual style changes.
Same profile in Rose
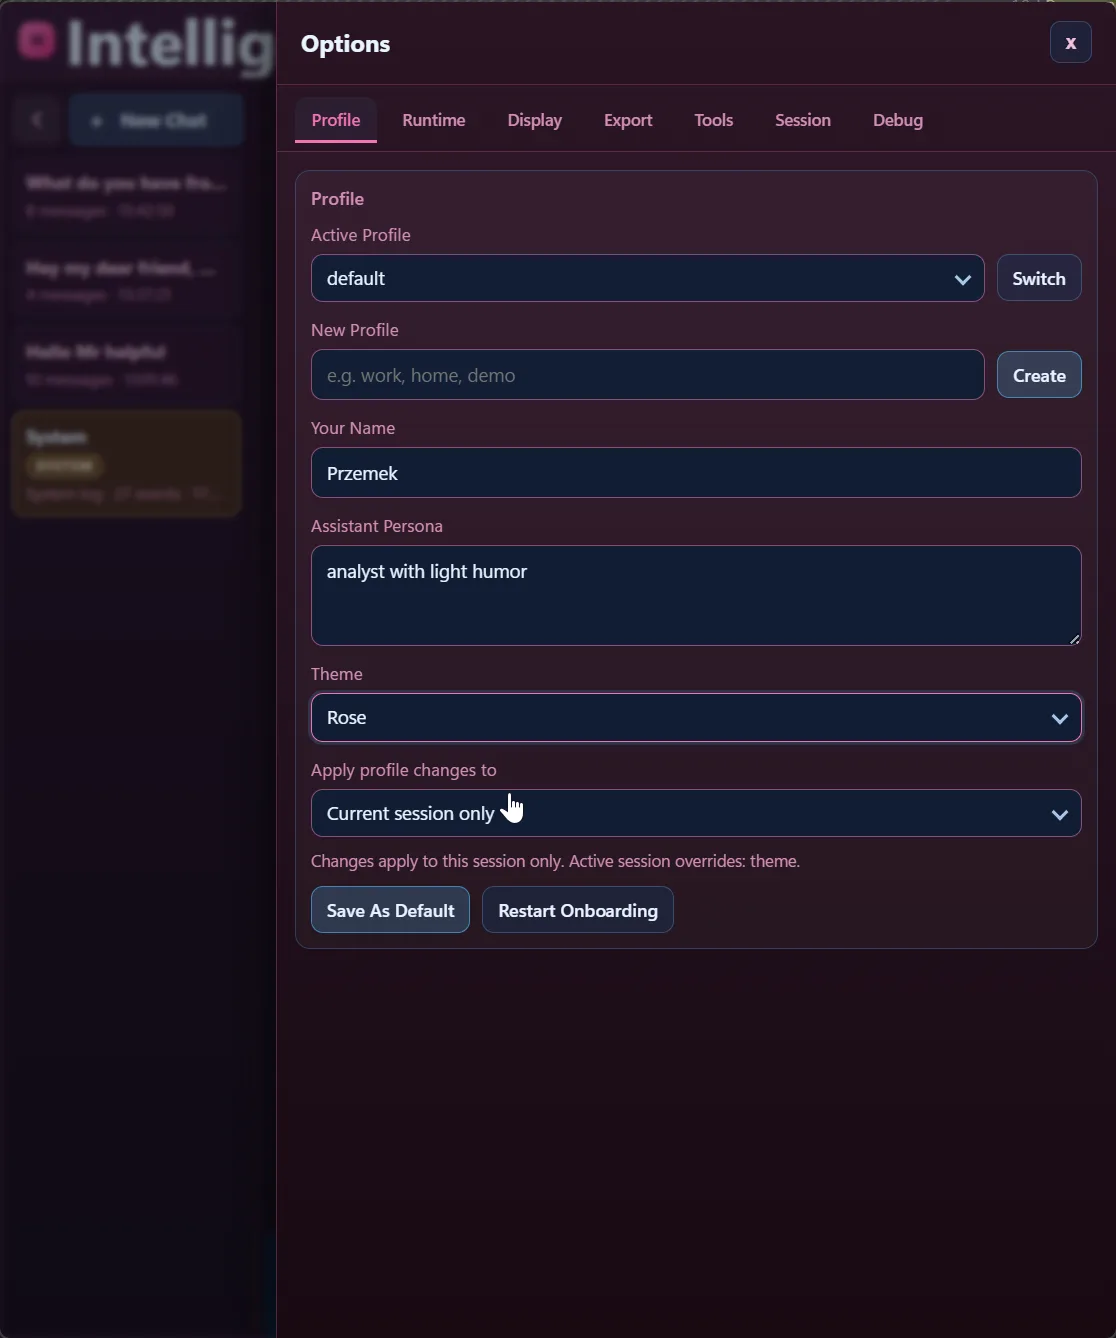
Same fields again, now Rose . Theme is still profile/session configuration, not a different runtime or tool mode.
System Options
This section is easy to misunderstand, so it is worth calling out: system messages are runtime/ops telemetry, not assistant reasoning.
Runtime restart timeline
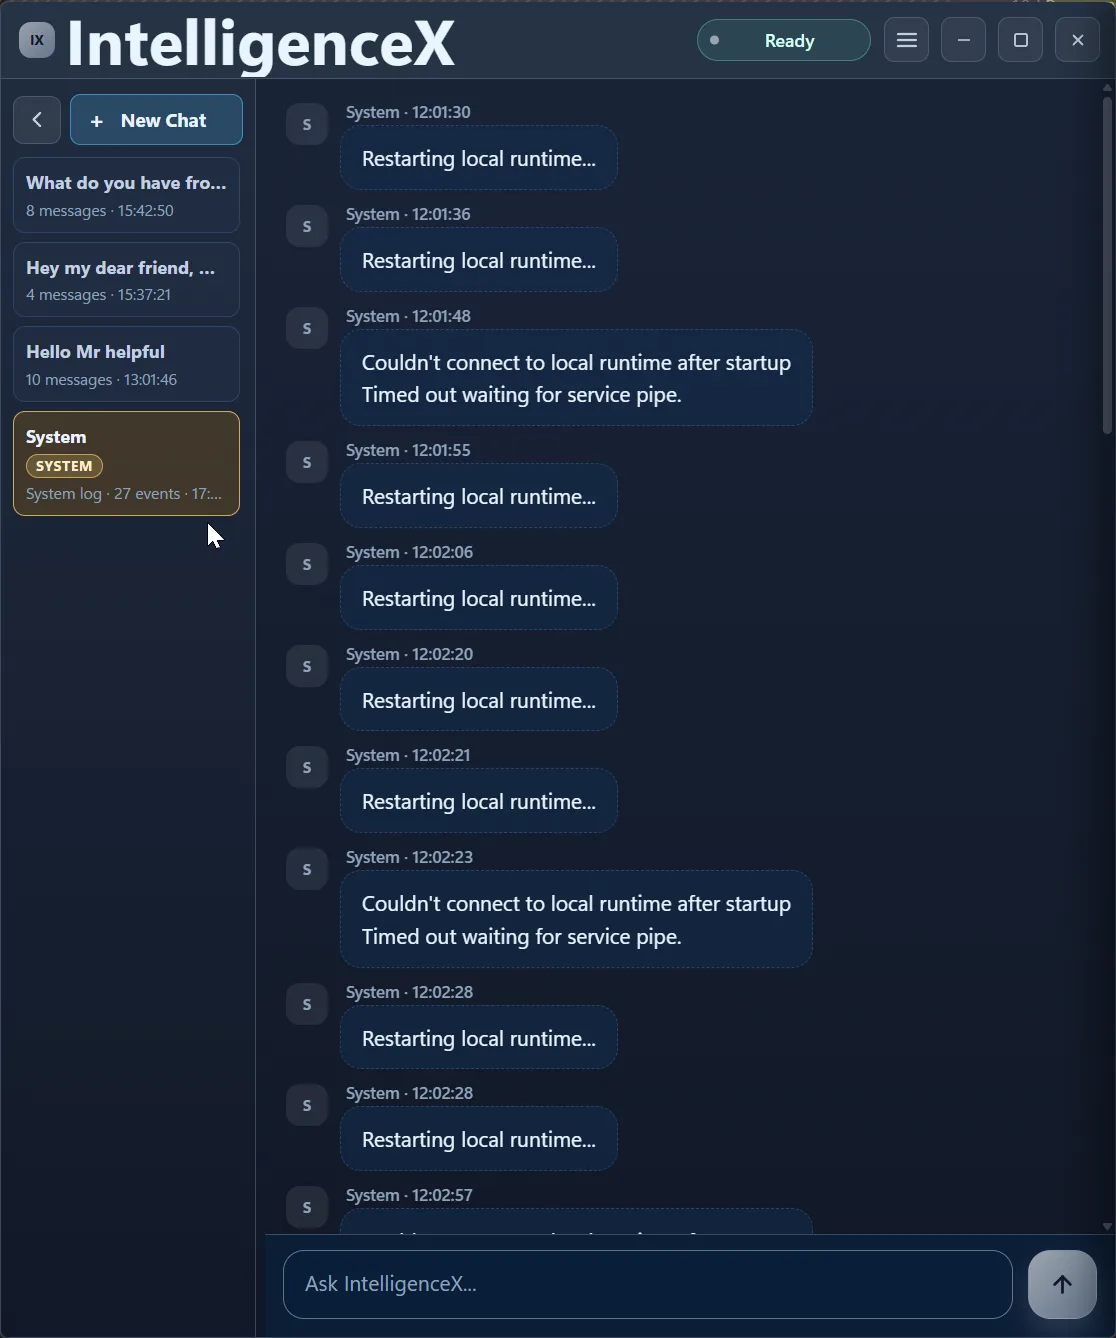
Here you can see repeated "Restarting local runtime..." events and timeout failures when connecting to the local runtime service pipe.
Tool health warning and export event
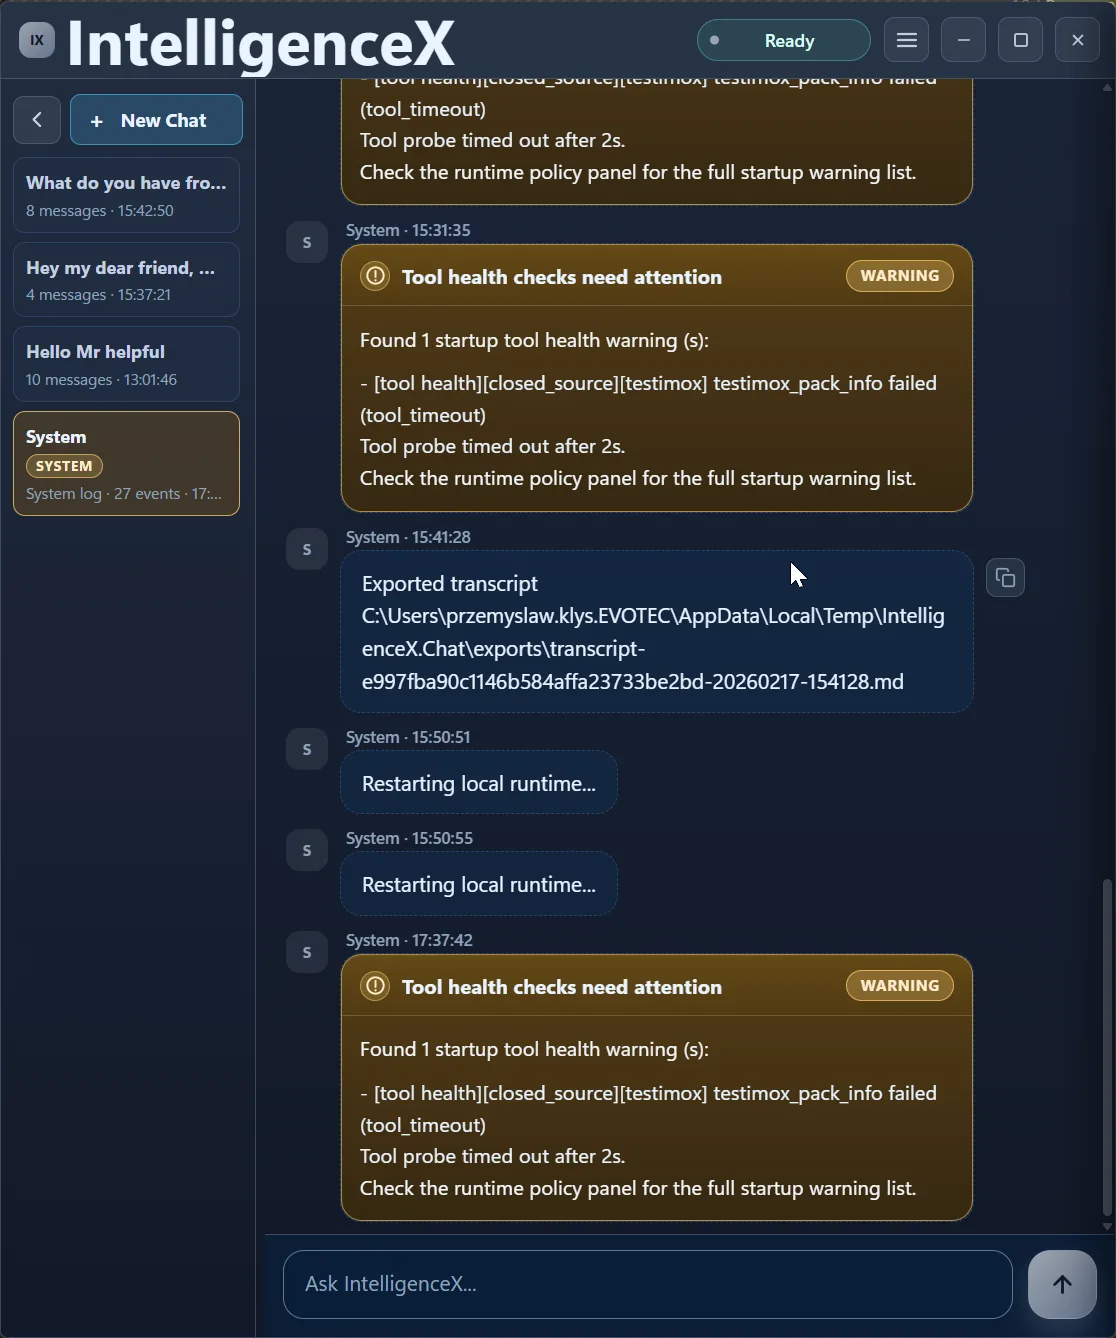
This one shows a "Tool health checks need attention" warning for a testimox_pack_info timeout, plus an exported transcript event. Again: operational telemetry, not model chat output.
Tools Available
The Tools tab is where you control scope. Stay high-level at pack level, or drill down into specific tools when you need precision.
Pack-level overview
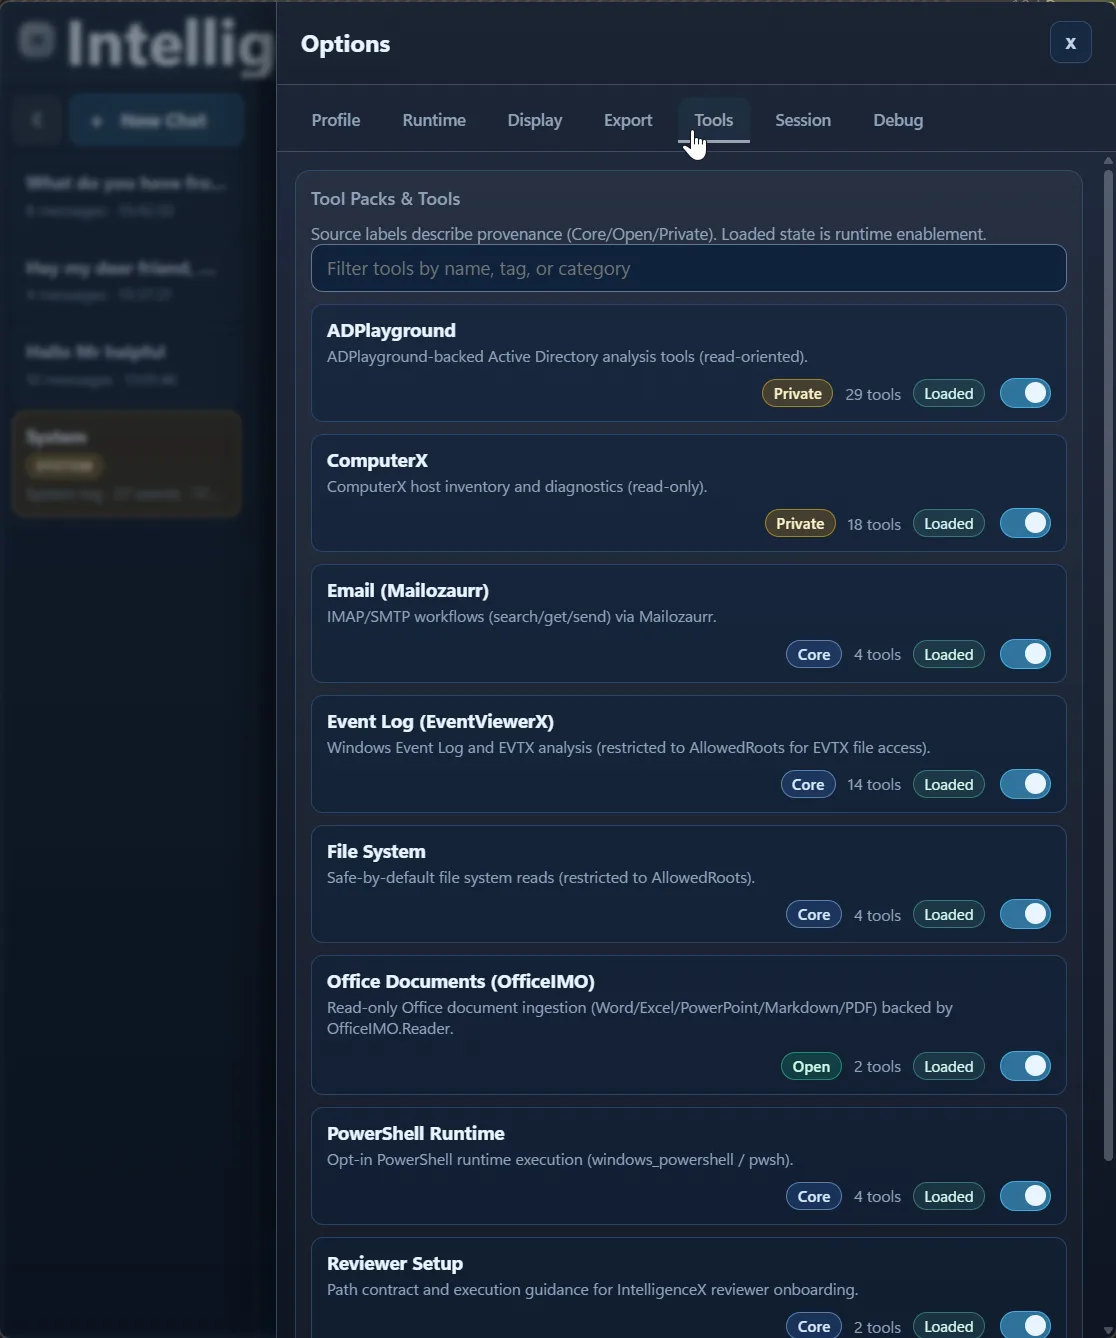
Pack cards show provenance labels ( Private/Core/Open ), tool counts, loaded state, and toggles.
ADPlayground expanded
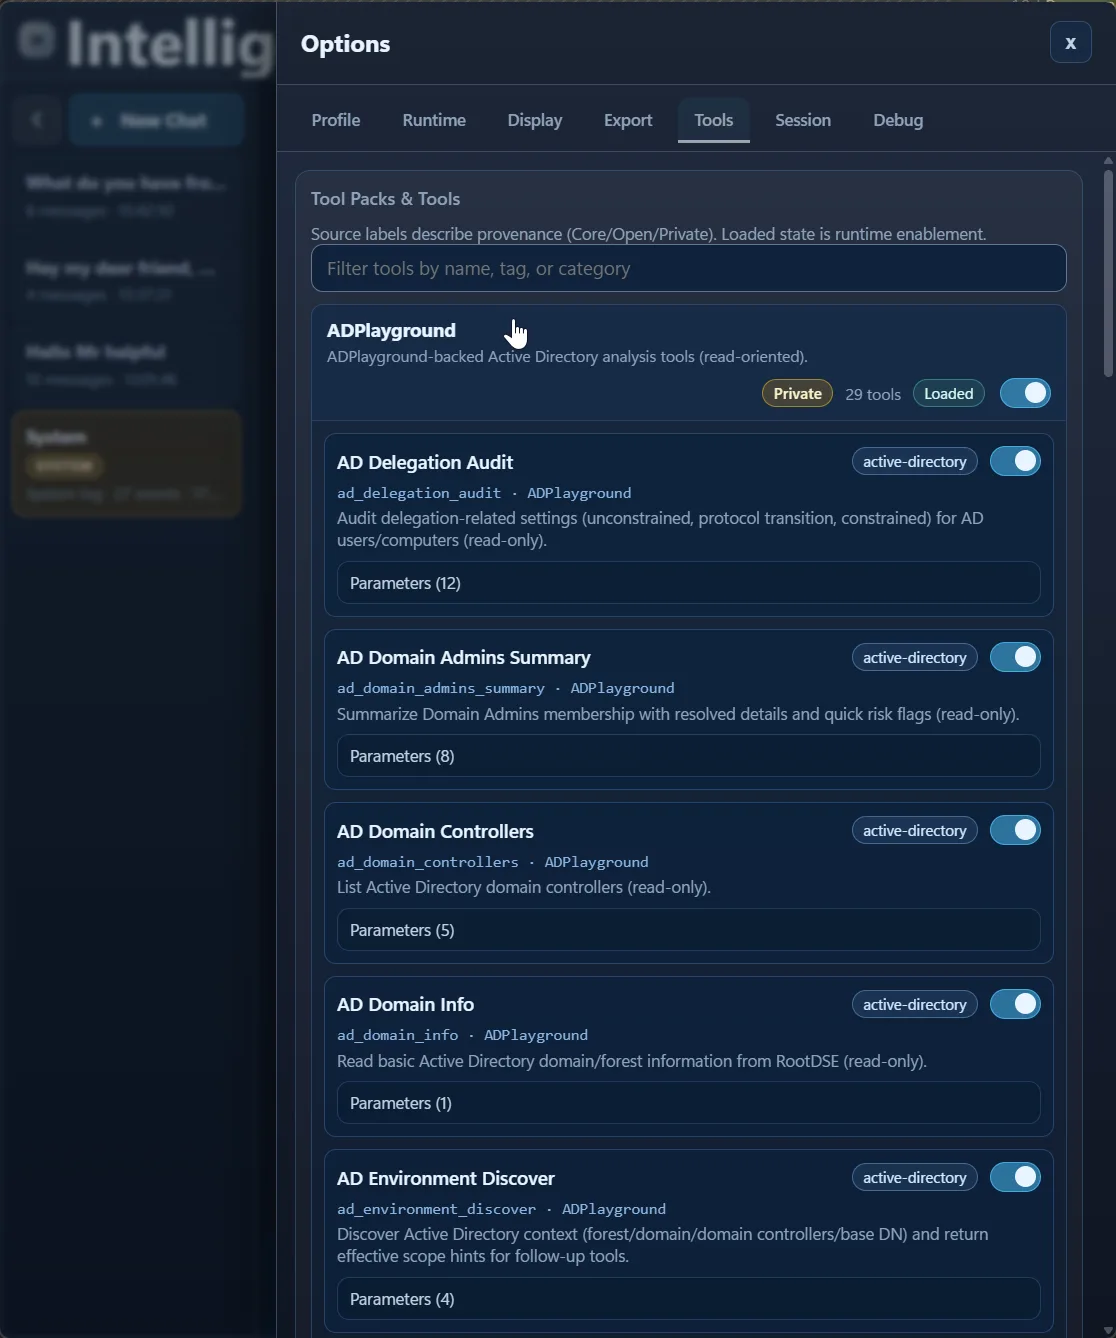
ADPlayground is expanded here to concrete AD tools like delegation audit, Domain Admin summary, and domain info, each with parameter counts and individual toggles.
TestimoX expanded
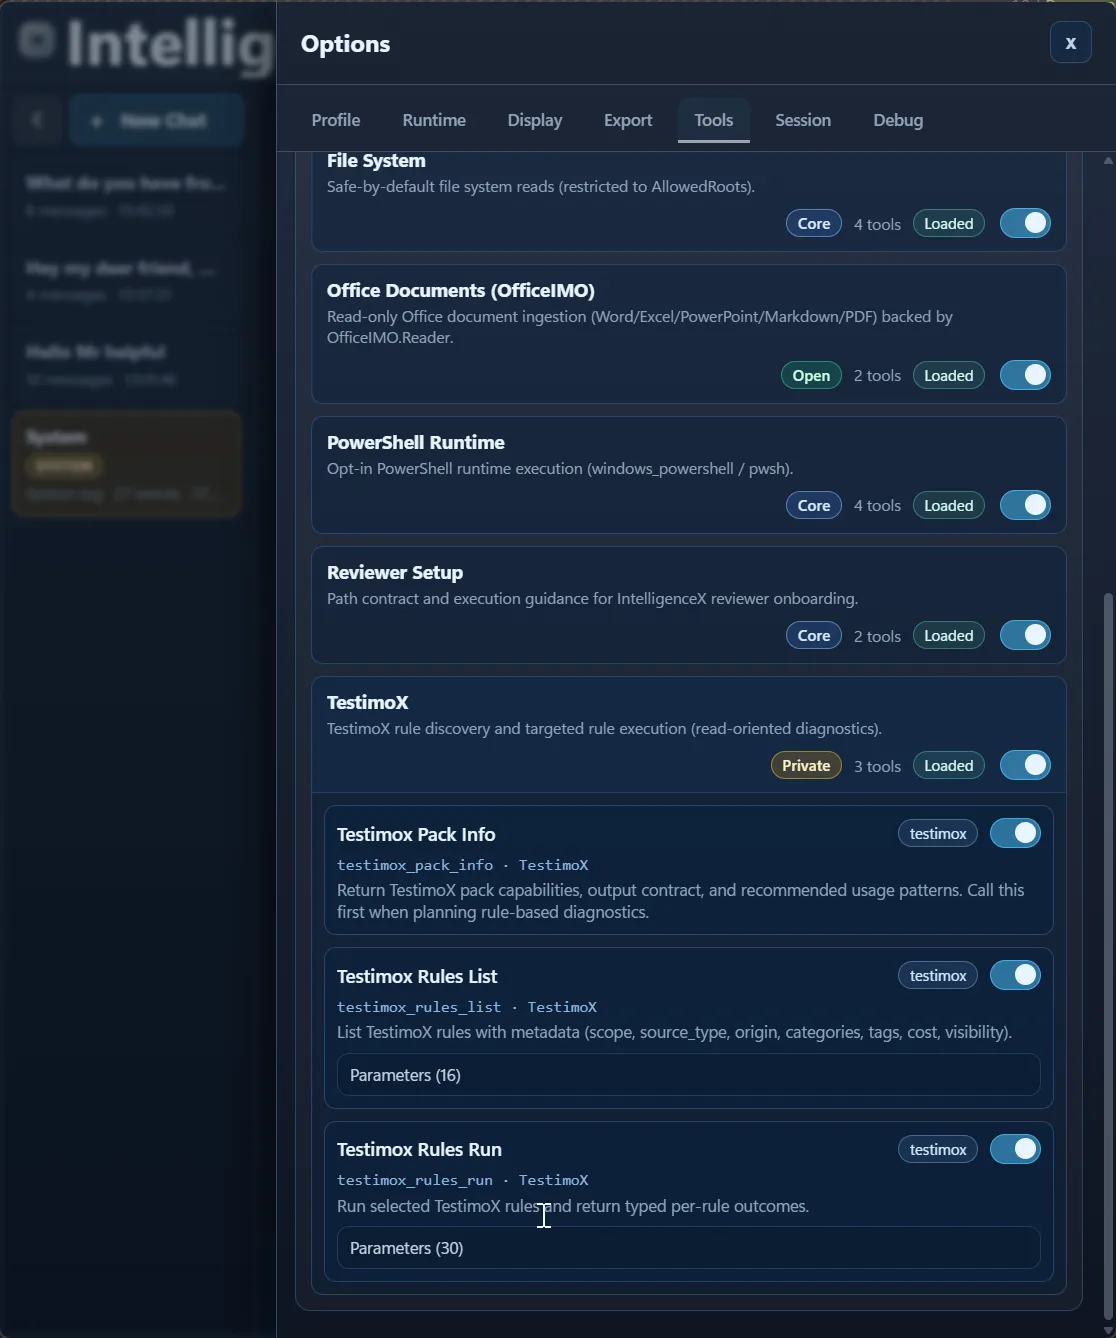
Further down in the same panel, TestimoX is expanded and shows testimox_pack_info , testimox_rules_list , and testimox_rules_run .
EventViewerX expanded
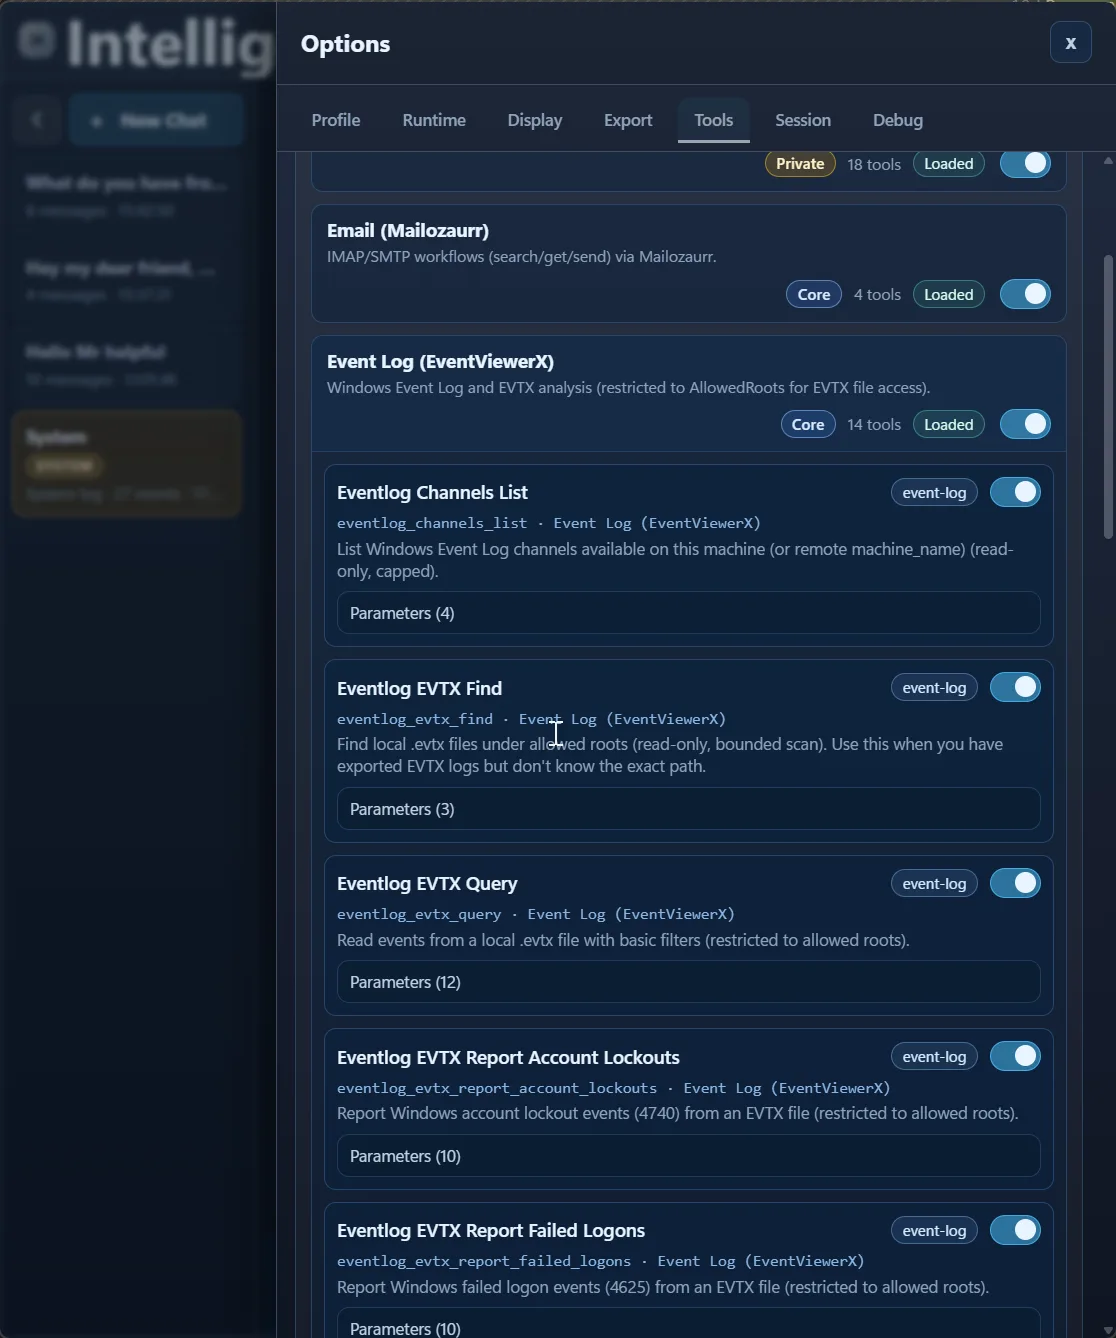
Event Log (EventViewerX) is expanded with channels_list , evtx_find , evtx_query , and report helpers, again with per-tool toggles and parameter counts.
What Works Well In Practice
- Keep profiles task-specific so behavior stays predictable.
- Prefer short iterative prompts over one giant instruction dump.
- Enable only the tool packs and tools you actually need.
- Turn successful threads into team playbooks for faster onboarding.
A companion "first 10 minutes" quickstart can extend this walkthrough with one concrete scenario from start to finish.