Event logs can be overwhelming fast, especially when three domain controllers are all shouting at once. This walkthrough shows a real IntelligenceX session where we started broad, narrowed scope, pulled raw evidence, and ended with a practical fix-first order.
The Situation
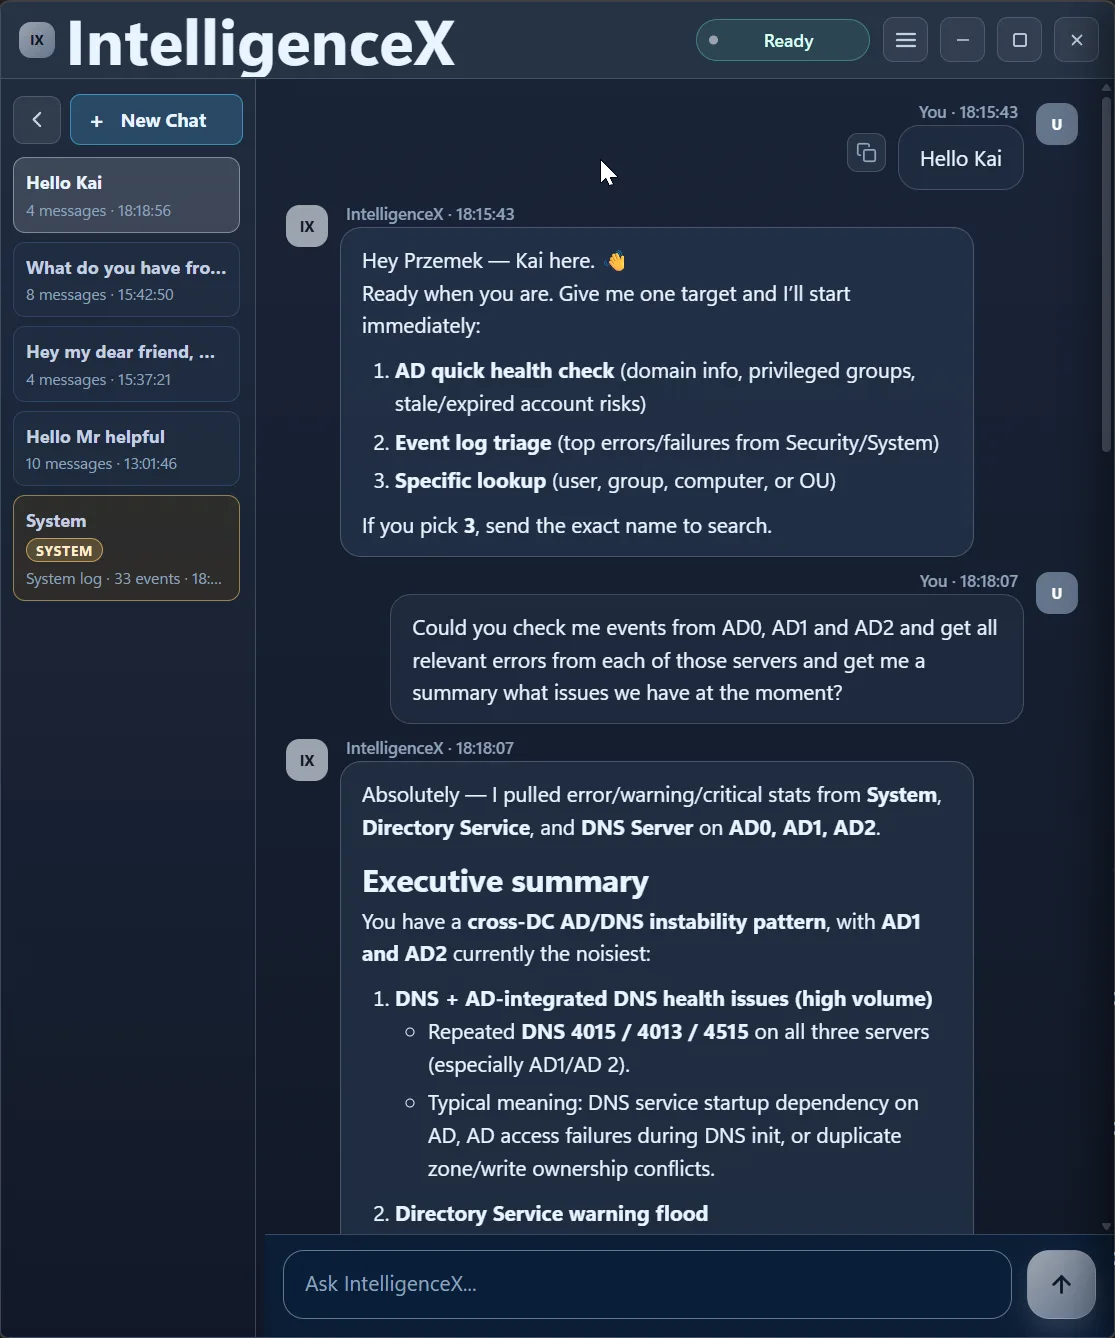
The ask was straightforward: check AD0, AD1, and AD2, pull relevant errors, and summarize what is wrong right now.
First Pass: Find the Cross-DC Pattern
The first response is a broad triage across System, Directory Service, and DNS Server channels. It immediately highlights a pattern instead of isolated errors: AD1 and AD2 look noisier, AD0 has NETLOGON signal, and DNS/DS warnings appear across the estate.
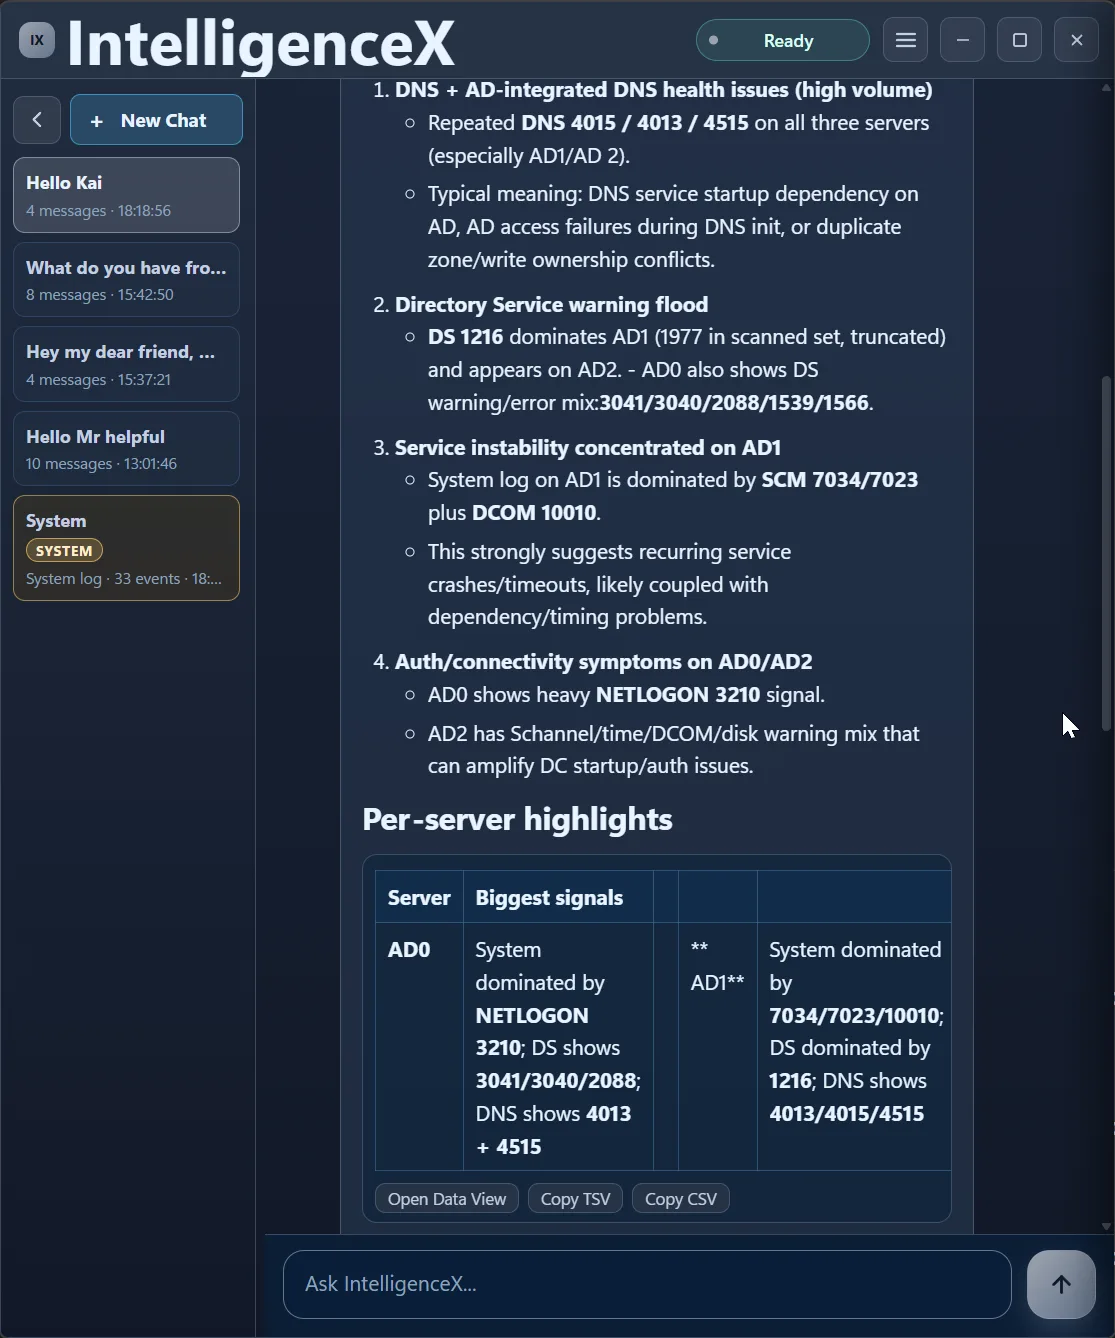
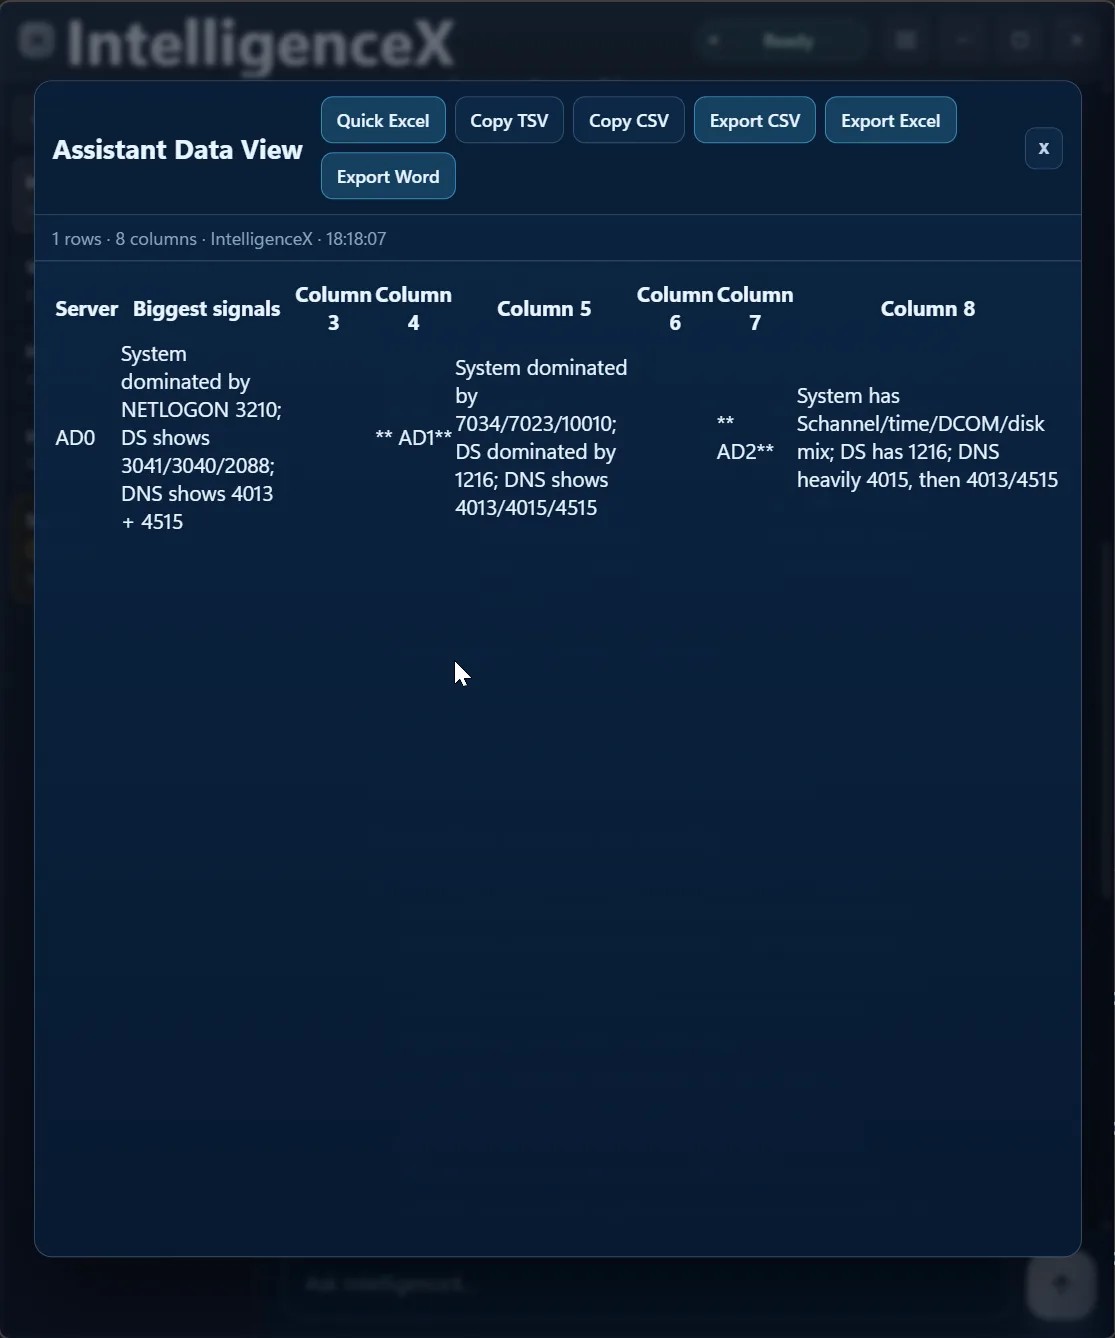
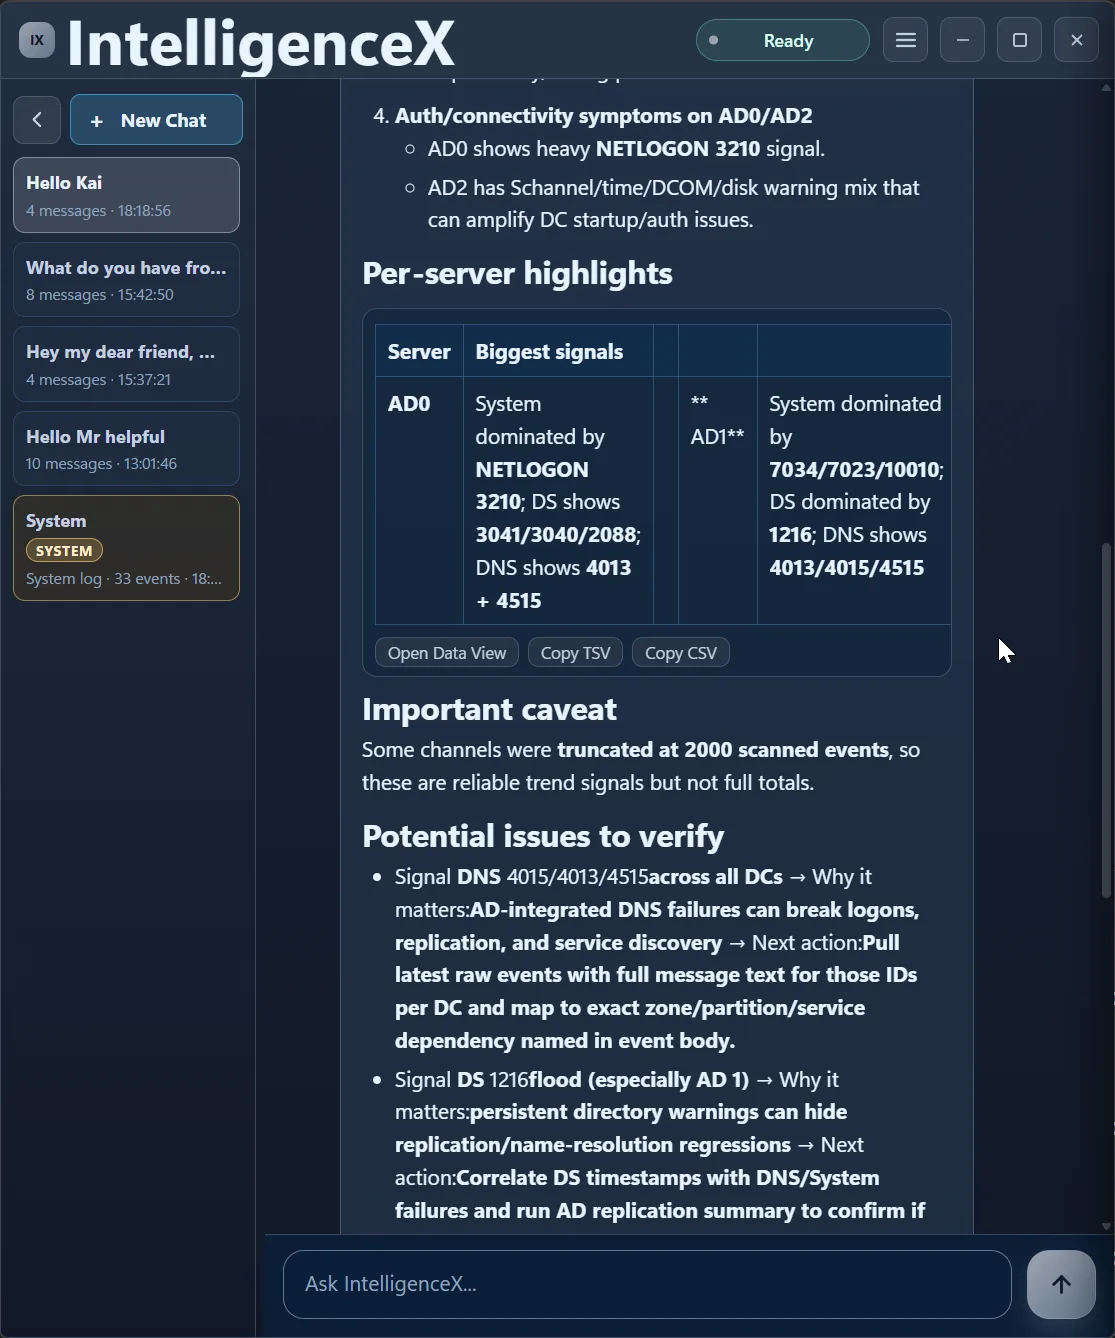
The summary is not locked in a paragraph either. You can open it as a table view and export it for sharing or deeper analysis.
The first pass also calls out caveats (like truncated high-volume channels), then proposes what to verify next and where to focus first.
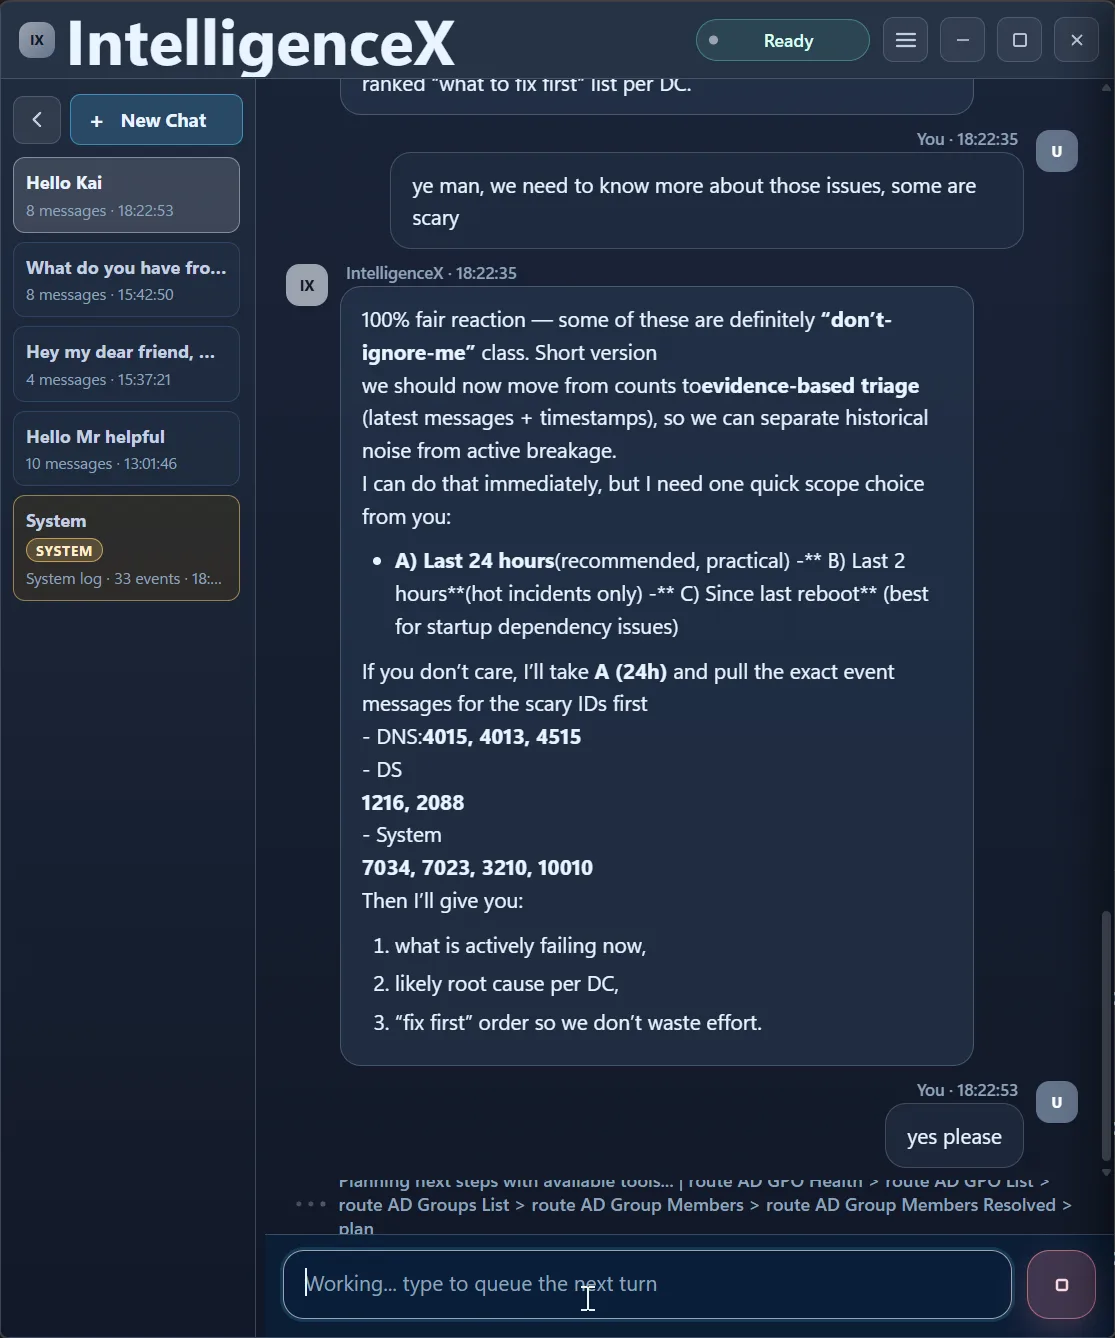
Second Pass: Narrow to What Is Active Now
This is where the flow becomes useful in practice. Instead of guessing, the assistant asks for scope: last 24h, last 2h, or since reboot.
After selecting 24h, the analysis immediately re-runs in a focused window.
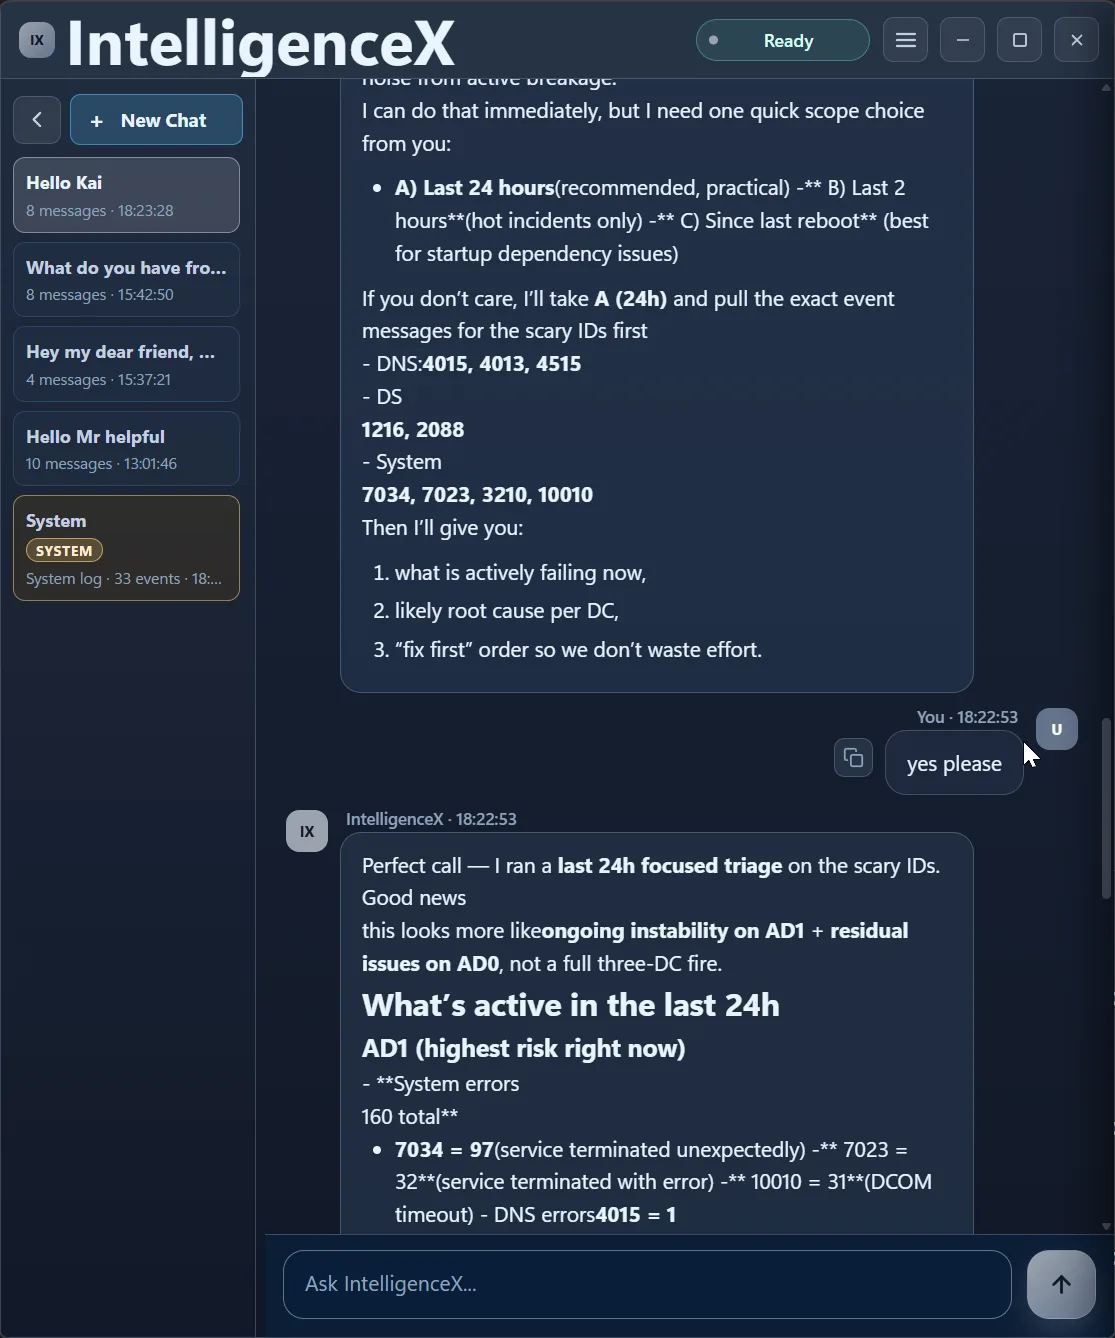
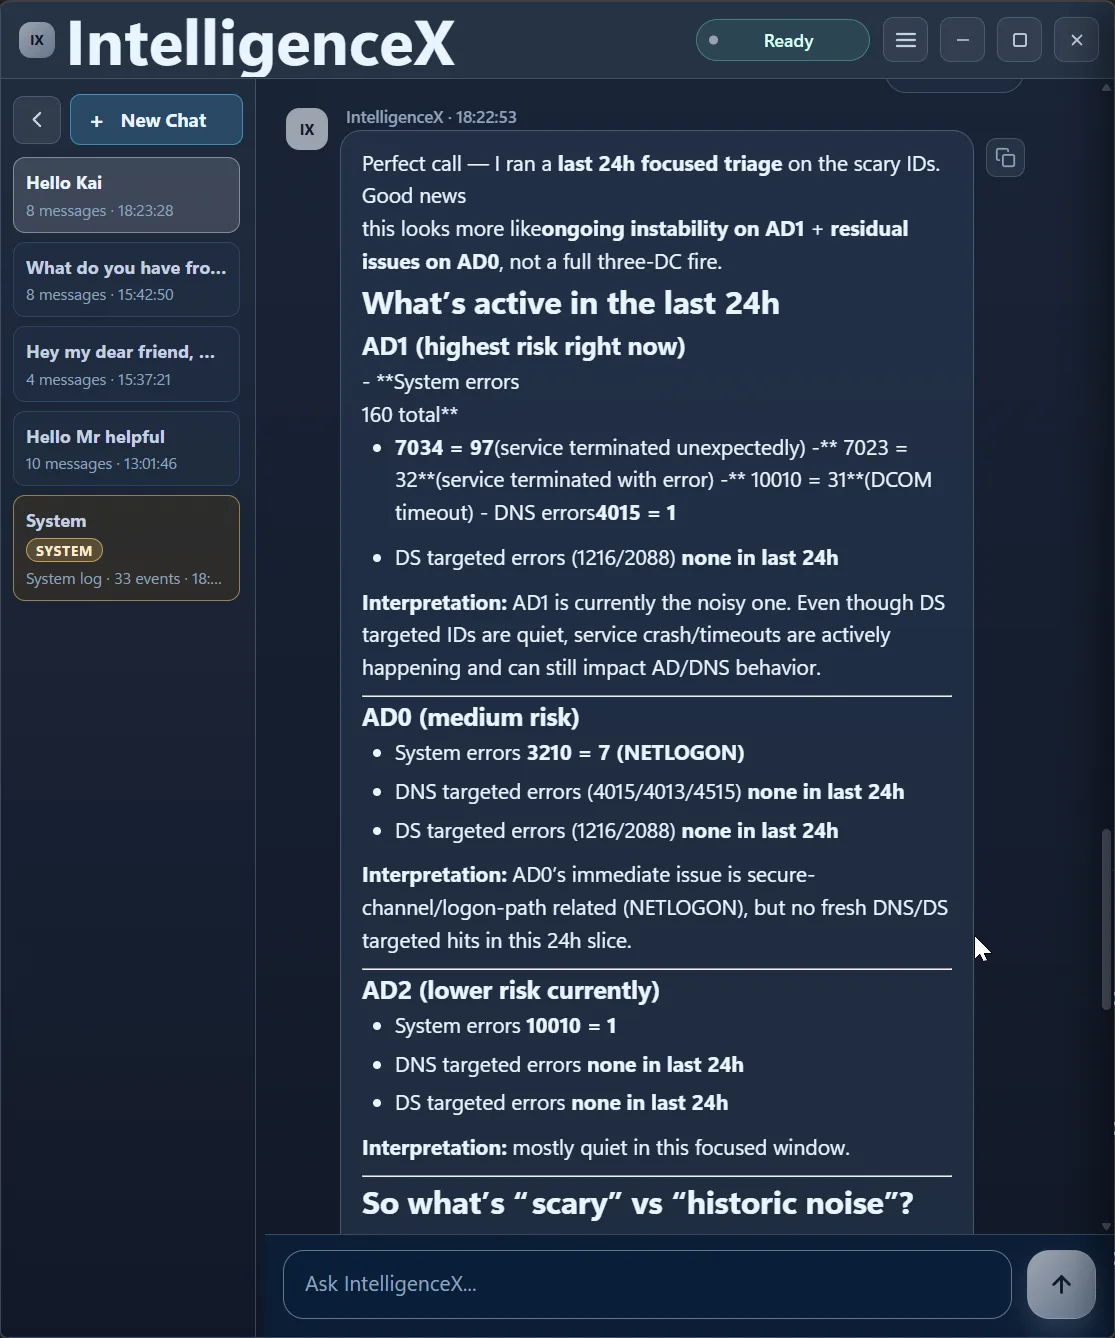
Third Pass: Separate Active Risk from Historic Noise
Now the correlation is time-aware. AD1 is flagged as highest active risk, AD0 as medium, AD2 as lower in this window. That is a very different operational story than "everything is broken everywhere".
The assistant then gives targeted next fixes, not a shotgun list.
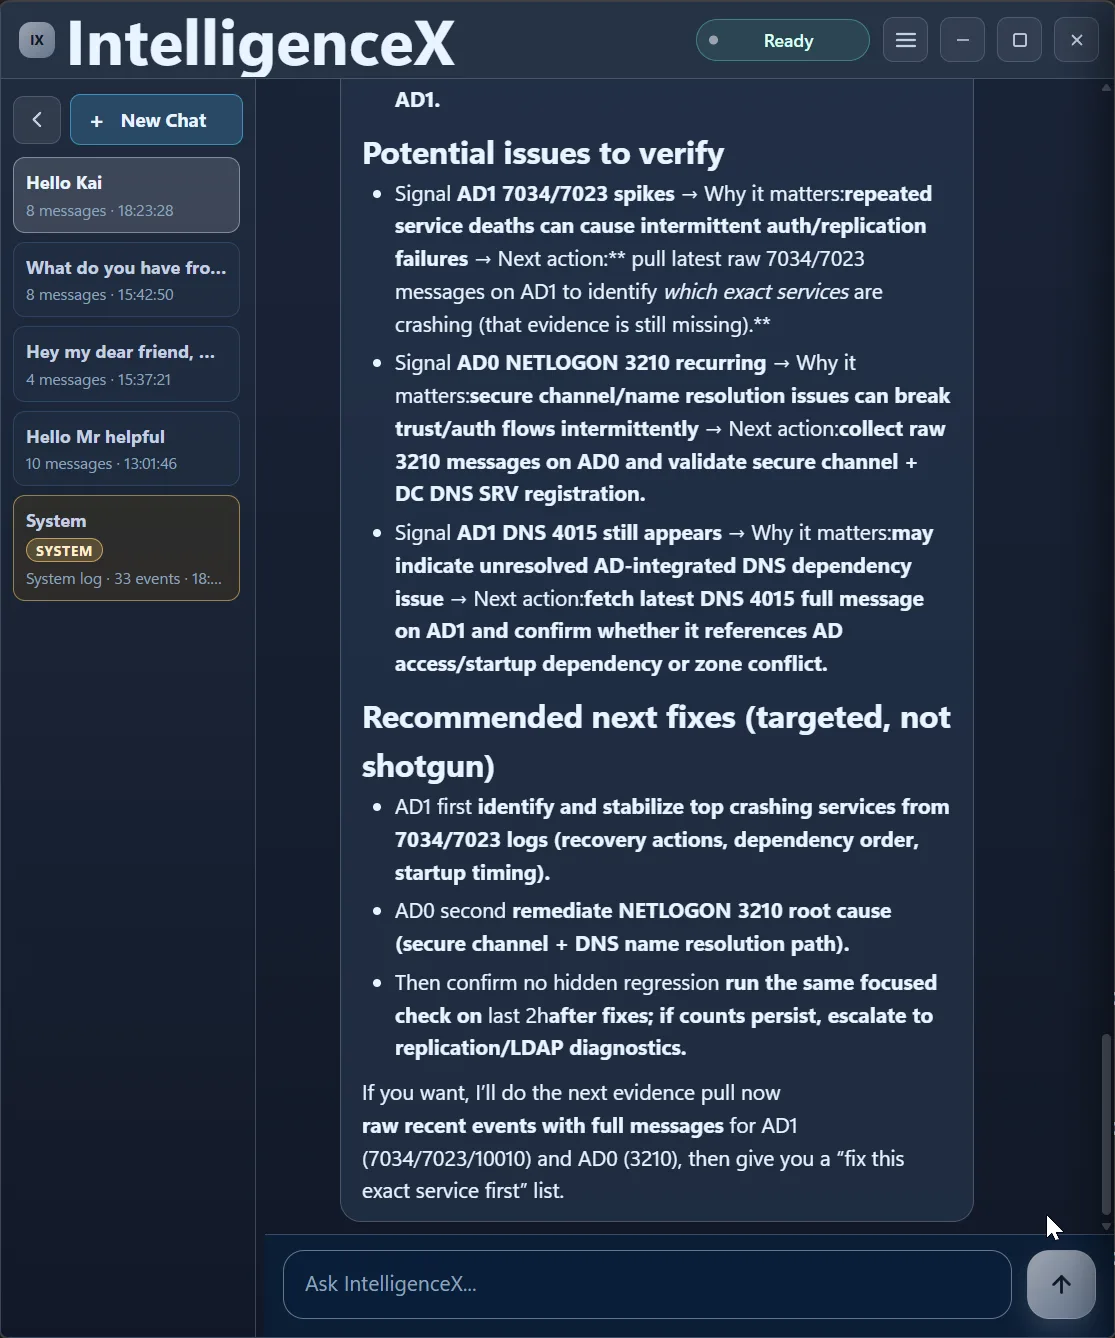
And before over-committing to root cause claims, it explicitly asks for one more evidence pull (raw event messages).
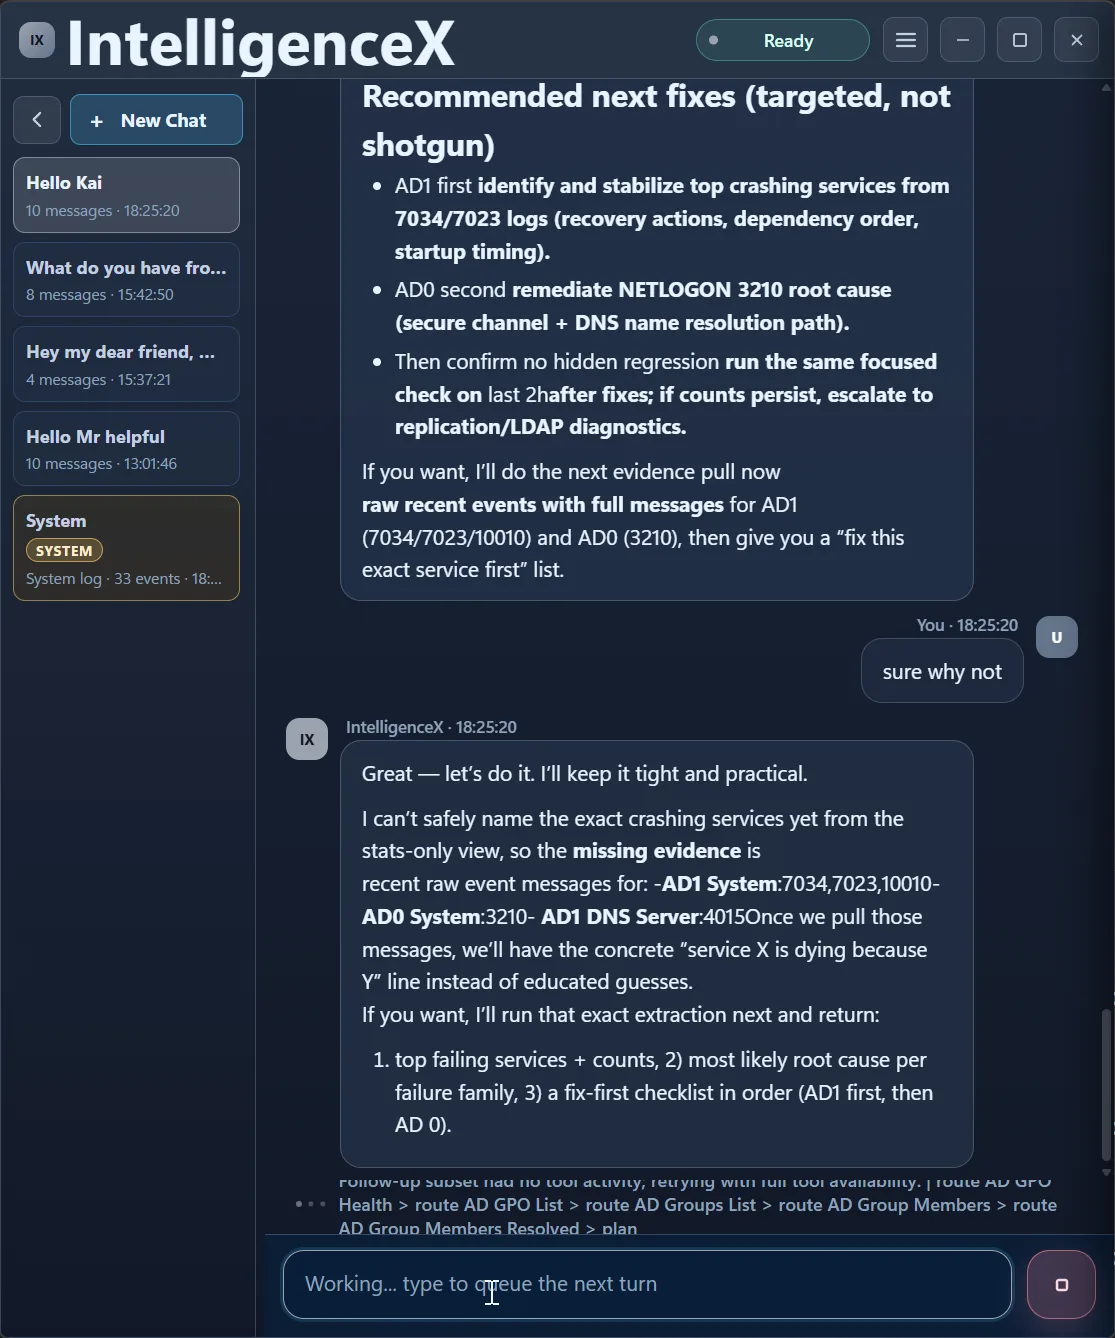
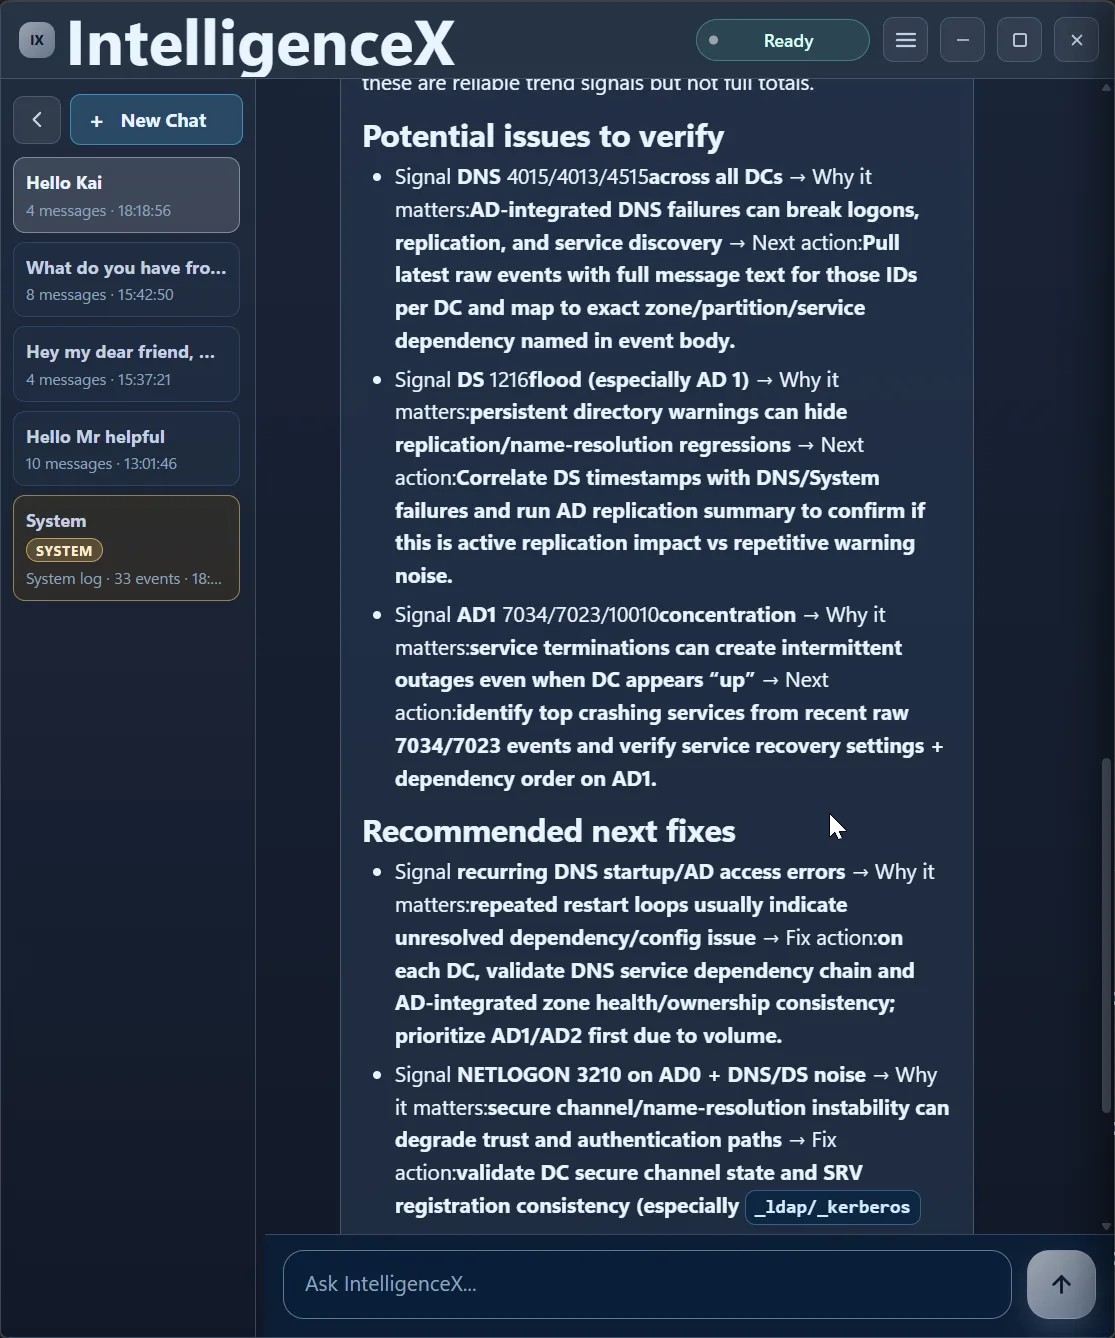
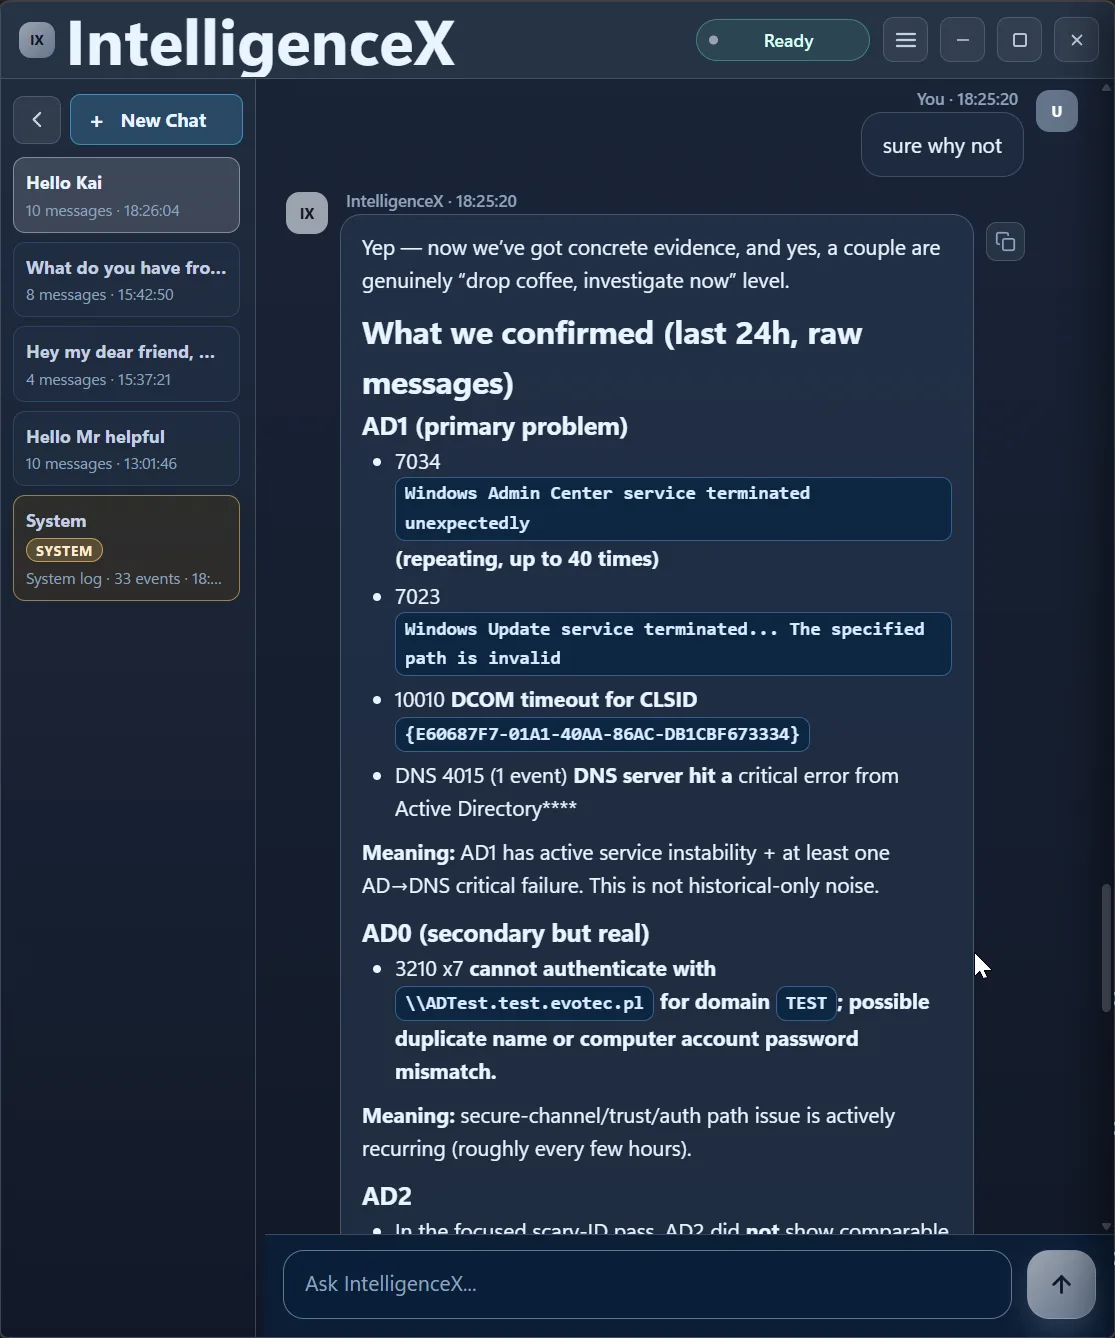
Fourth Pass: Raw Messages to Concrete Actions
With raw messages included, the output becomes specific: recurring Windows Admin Center crashes, Windows Update path issues, DCOM timeout CLSID evidence, DNS 4015 on AD1, and recurring NETLOGON 3210 on AD0.
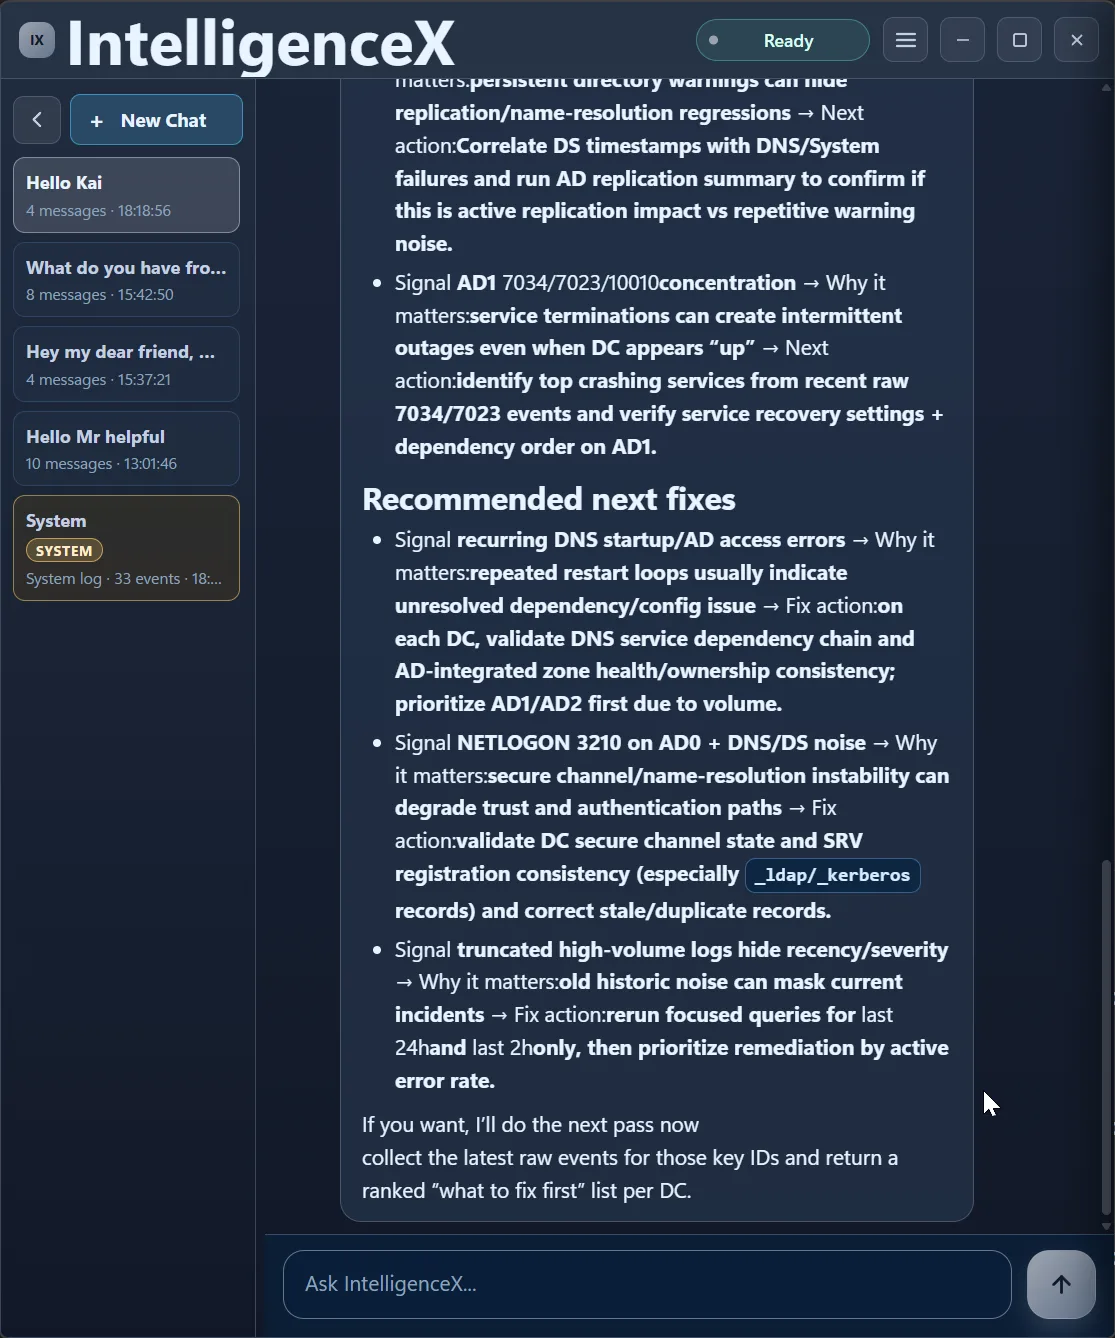
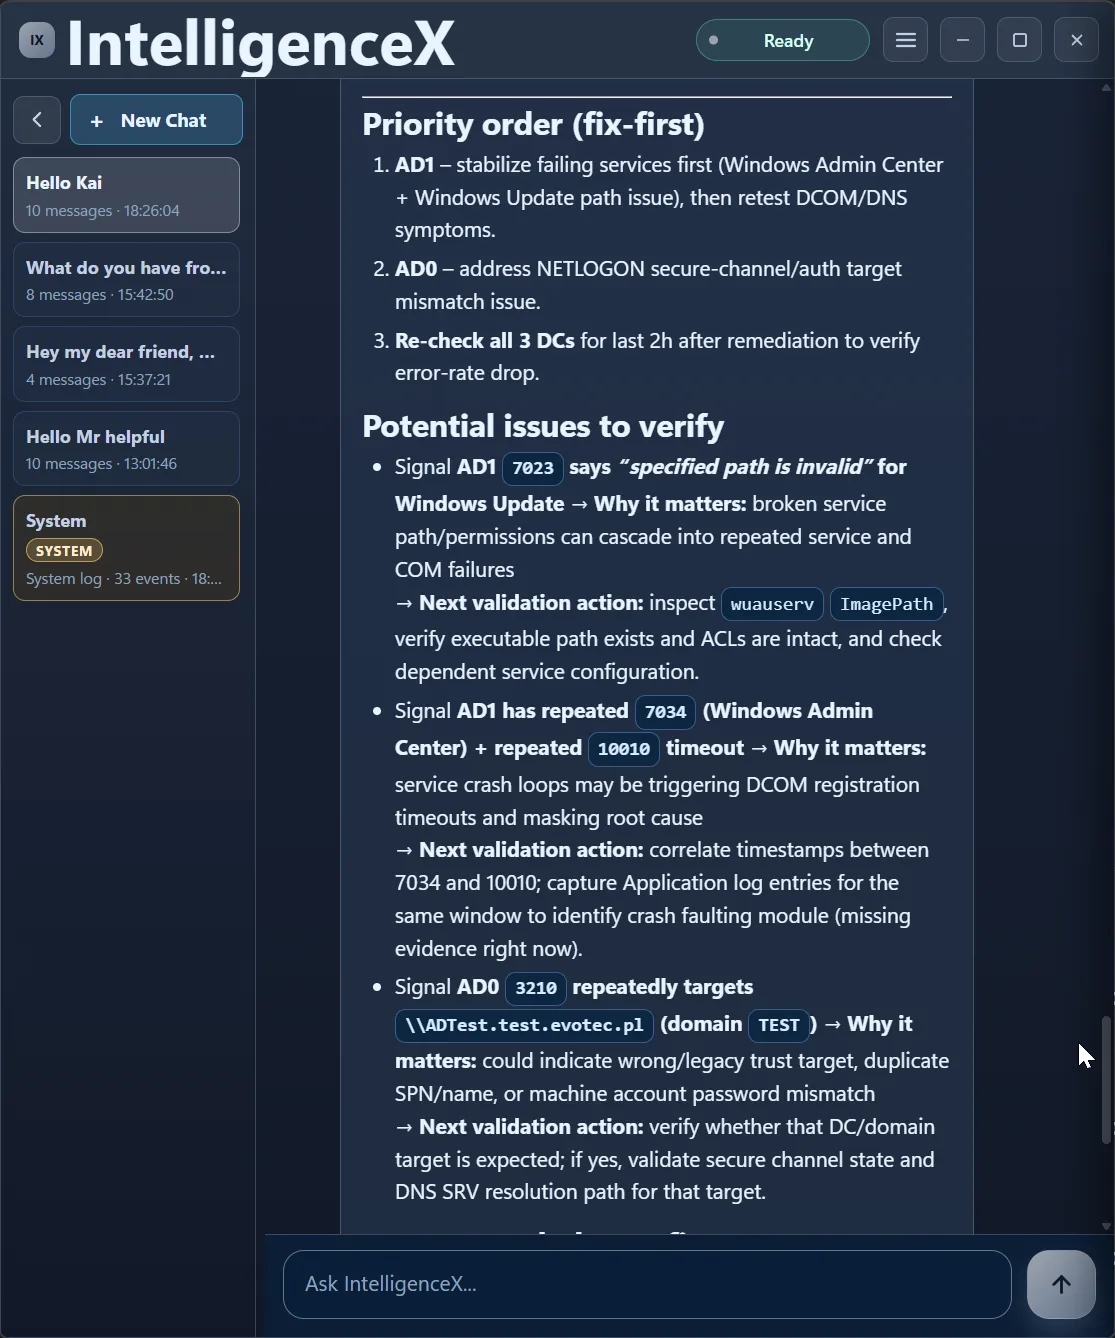
From there, the assistant builds a clear fix-first order.
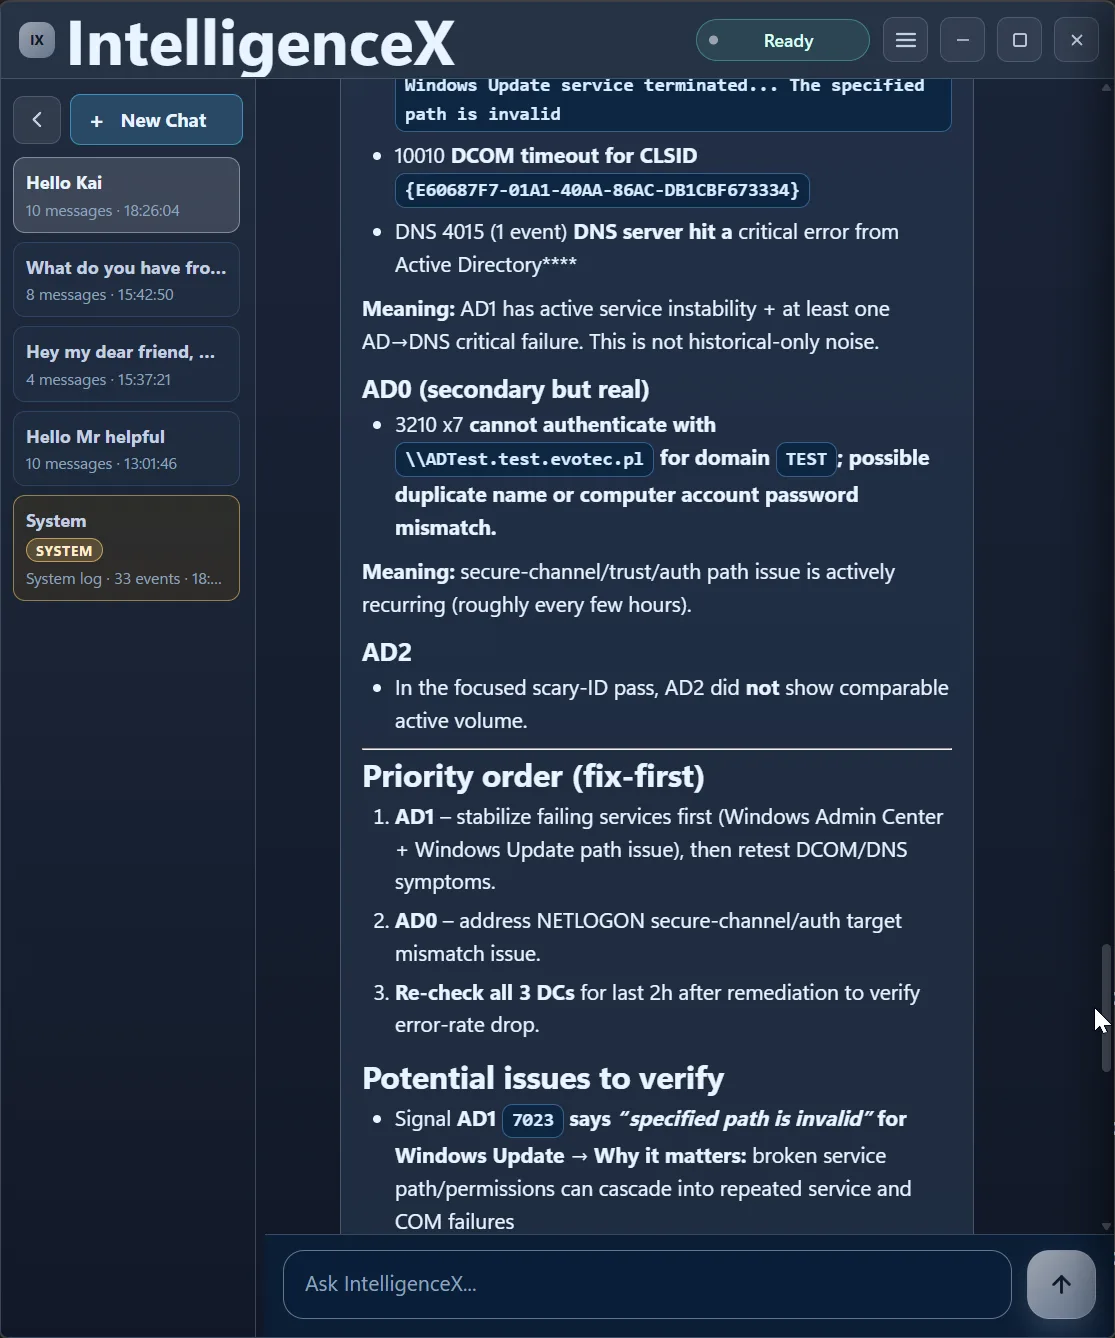
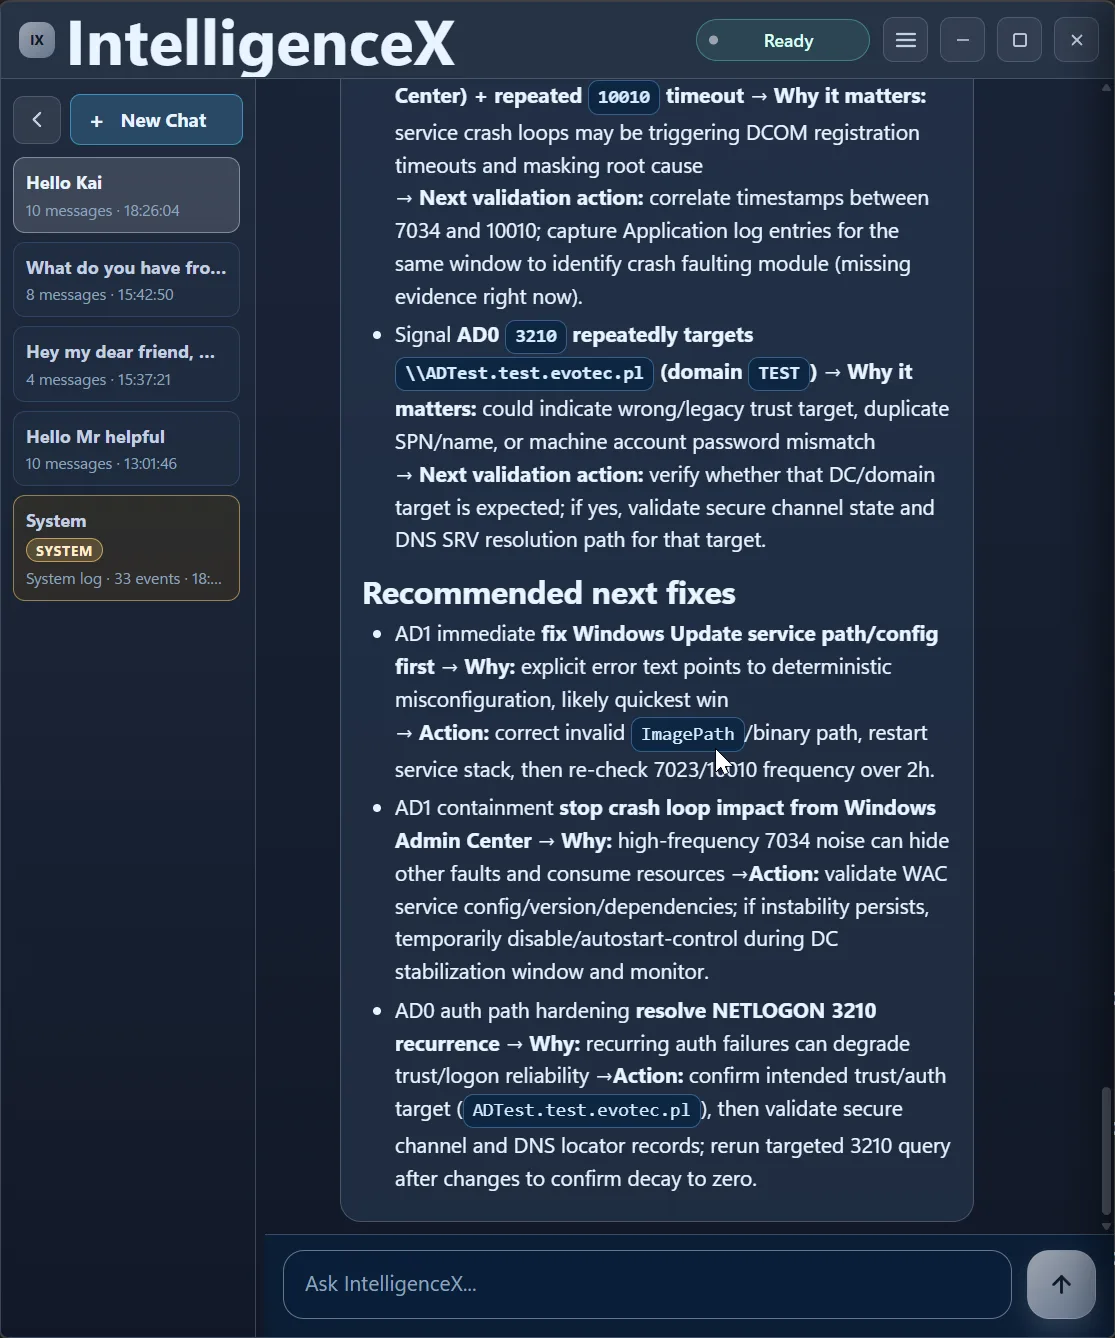
It also keeps traceability by pairing each signal with why it matters and the exact validation action.
Finally, it closes with practical remediation actions in sequence.
Prompt Pack You Can Reuse
If you want the same signal progression in your own environment, this prompt sequence is a reliable starter:
Pass 1 (broad):
Check AD0, AD1, AD2 event logs for current errors and summarize cross-DC patterns.

Pass 2 (time scope):
Now scope that to last 24h and separate active risk from historic noise.

Pass 3 (evidence escalation):
Pull raw event messages for top recurring errors before naming root causes.

Pass 4 (fix order):
Build a fix-first sequence with validation steps after each fix.
Export and Handoff Pattern
Use the Data View export buttons from the triage response at each pass:
- Export broad-pass summary (CSV/Excel) for immediate team visibility.
- Export scoped 24h summary (CSV/Excel) for on-call execution.
- Export final fix-first checklist (Word/Excel) for change tracking.
This keeps the incident thread consistent from first triage to post-fix verification.
How Correlation Happens During the Run
What makes this useful is that correlation is not a one-shot result. It evolves as evidence improves:
- broad sweep first: normalize signals across DCs and channels
- scoped time windows next: separate active incidents from background noise
- evidence escalation: move from counts to raw event messages before naming causes
- cross-signal linking: connect service crashes, DCOM timeouts, DNS failures, and NETLOGON symptoms
- priority ordering: produce a fix-first path based on active blast radius
Why This Helps in Real Operations
- You get a decision path, not just a pile of event IDs.
- You avoid panic by proving what is active now versus what is historical noise.
- You can hand off quickly using table/extract exports and concrete next validation steps.
- You get practical sequencing, so teams can fix in the right order and then re-check the same window for regression.
A remediation-focused follow-up can document the exact runbook: what to execute first on AD1, what to validate on AD0, and how to confirm stability in the next 2-hour recheck.